
Calibrating Prediction: What Difference Does it Make?
Share

There are many things we do within their software to maximize prediction accuracy and optimize the design of networks – 3D modeling, inclined surfaces, body loss modeling, etc – but one of the less talked about yet more powerful ways to maximize prediction results is by using the ‘Prediction Calibration’ feature in the software.
What does it do?
Simply put, with prediction calibration, you can use your survey measurements to calibrate the prediction results of your design.
Why do we have this?
Because no matter how accurately you model your venues with the right materials, you don’t always know what is behind the materials (think steal beams behind drywall for example), or what else is impacting the signal attenuation in a particular space. By using real data to calibrate the prediction algorithm in the software, you will end up with the most realistic prediction results.
Let’s look at the potential difference it can make.
Prediction Results with No Calibration
This floorplan is a basic small/medium sized office space – survey has been done to collect the measurements, and the 3 AP design has been completed.
Looking at the RSSI heatmap, and probing a specific area of the floor you can see the following signal strength predictions for 2.4GHz/5GHz.
| RSSI Prediction Value (dBm) | |
| 2.4GHz | -55.72 |
| 5 GHz | -69.21 |
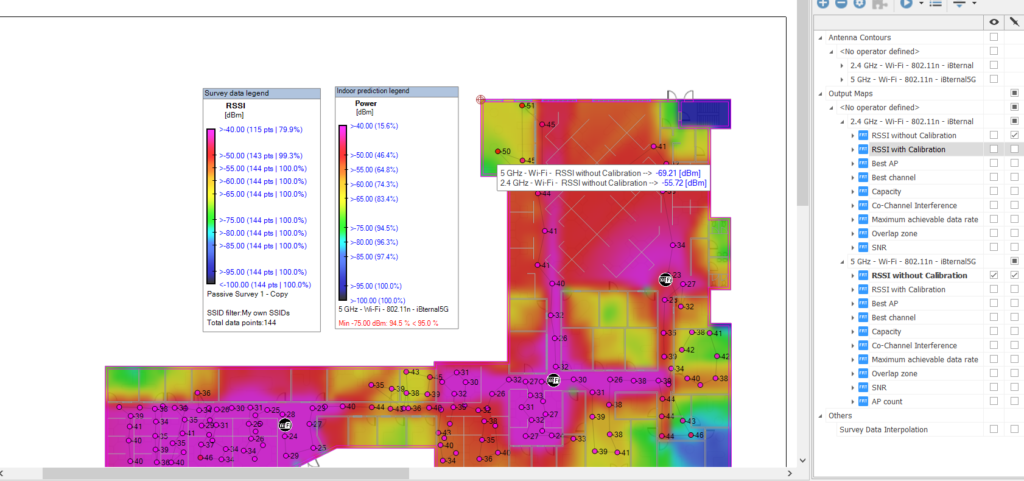
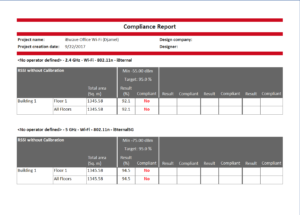
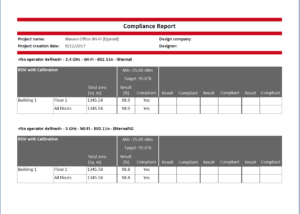
And when you run the compliance report showing the prediction results against the design requirements for each band, you can see that neither 2.4GHz or 5GHz requirements are met.
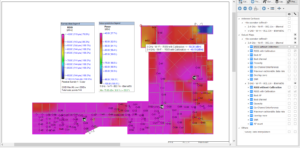
Prediction Results with Calibration
After setting up the calibration model using the measurement data collected during the site survey, the prediction results change and show the following values:
| RSSI Value (dBm) | |
| 2.4GHz | -49.19 |
| 5 GHz | -58.00 |
And re-running the compliance report, you can see that each band now meets it’s KPI design requirements.
Comparing Before and After Calibration
To look at the overall difference prediction calibration can make, let’s compare results of with and without calibration applied to the design:
| Without Calibration (dBm) | With Calibration (dBm) | Delta | |
| 2.4GHz | -55.72 | -49.19 | -6.53 |
| 5 GHz | -69.21 | -58.00 | -11.21 |
As you can see, the difference can make a meaningful difference, especially when you consider that prior to calibration the design was not meeting their KPI requirements for either the 2.4GHz or 5GHz bands. In this case, with no calibration, the designer may have made unnecessary design adjustments or added more equipment when was not necessary, adding more cost to the design. When using real measurements from the venue to calibrate prediction, you can achieve more realistic prediction results as well.
Wirelessly yours,
Kelly
Kelly Burroughs has worked in the wireless industry over the last 8 years in a variety of roles. Her background in product, marketing, and wireless jokes makes her a triple threat in the industry. When she’s not busy trying to improve the wireless survey & design experience for customers, she can be found writing wireless jokes that make even the most dedicated network engineer smile (or roll their eyes).
- A Tour of iBwave Viewer - November 23, 2020
- Introducing Augmented Reality in iBwave Wi-Fi Mobile - September 10, 2020
- What’s New in iBwave Wi-Fi 14.2 - August 25, 2020


