Forever on a quest to improve the accuracy of network predictions in our software, we recently released a new feature called “Body Loss Modeling.” With Body Loss Modeling, you can now account for the attenuation caused by bodies packed into a tight space together in your design – most useful for high-density venues like stadiums, arenas, or conference centers.
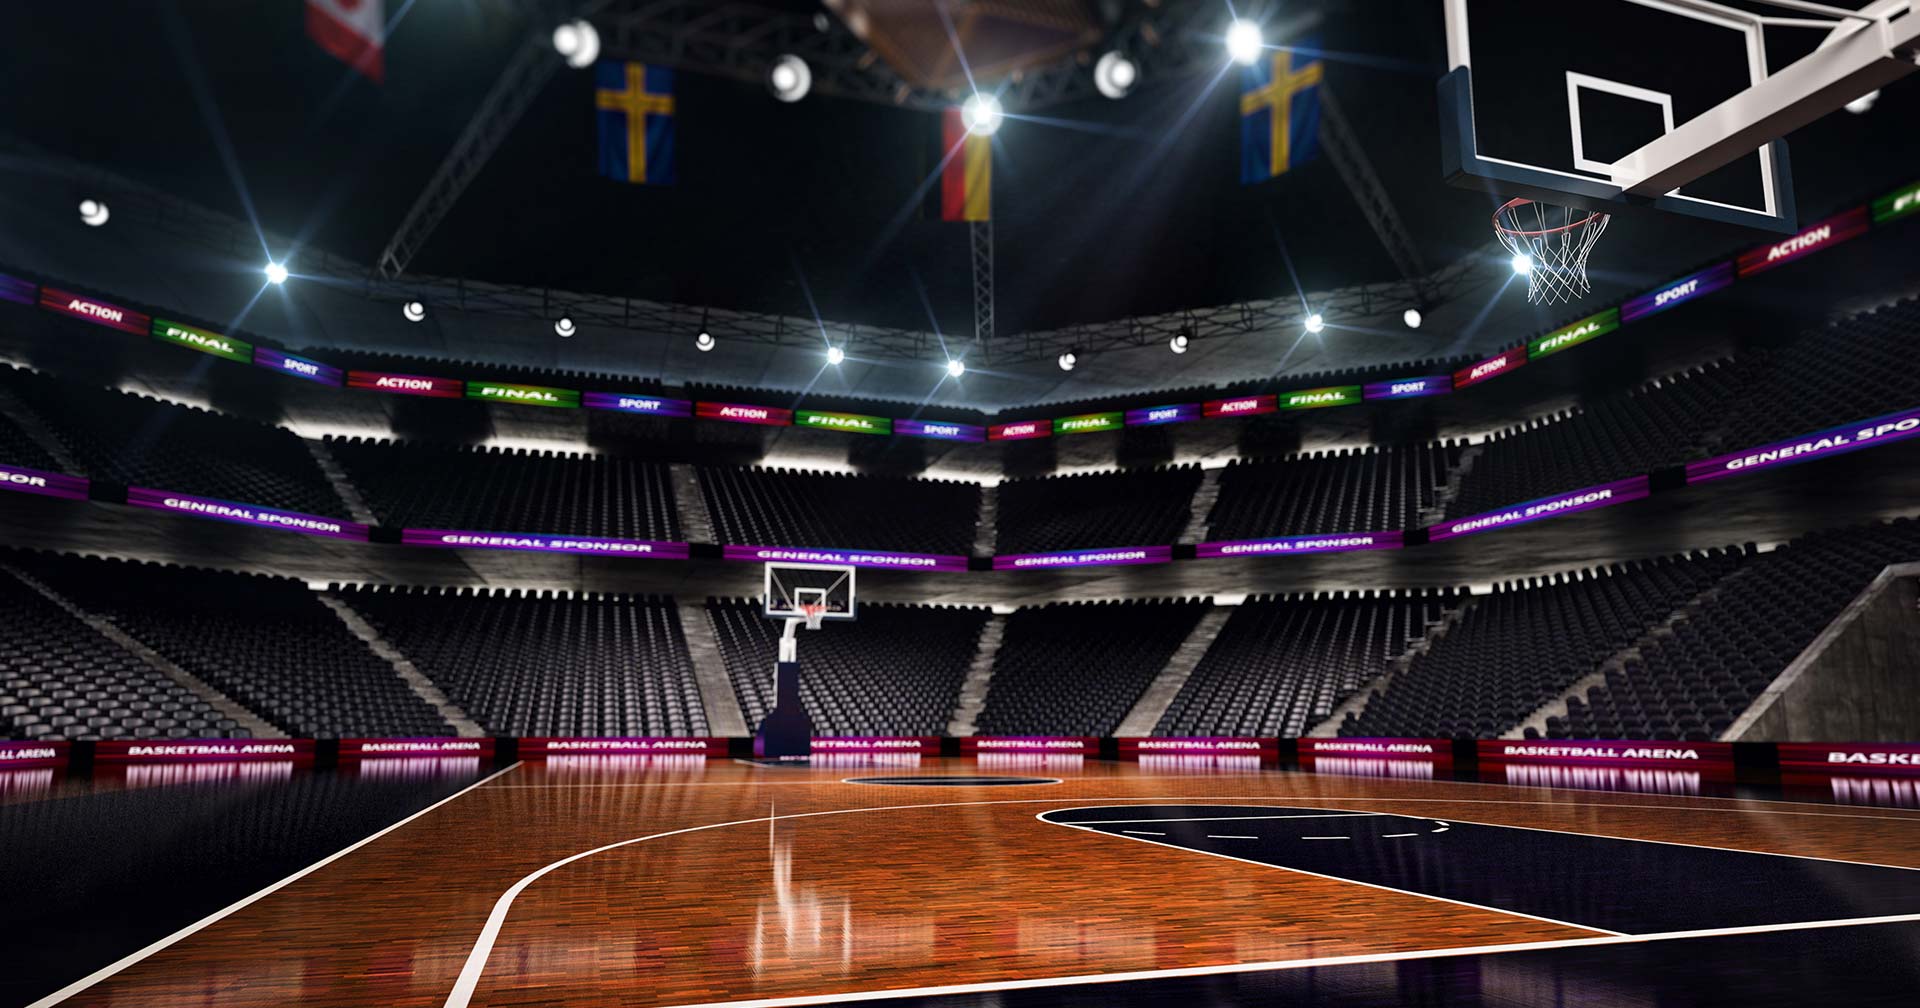
In this blog, I use the design of a basketball arena to examine the impact the body loss modeling feature can have on the prediction results of a network design.
I do that by isolating a small section of the arena seating, placing an Access Point and then looking at the results of both the Signal Strength and SNR heatmaps under two scenarios:
- No Body Loss Modeling
- With Body Loss Modeling
At the end, I’ll summarize the comparison and discuss the potential impact of the results.
Here is the basketball arena I am using, and the specific seating area looked at in this blog.?

Results: No Body Loss Modeling
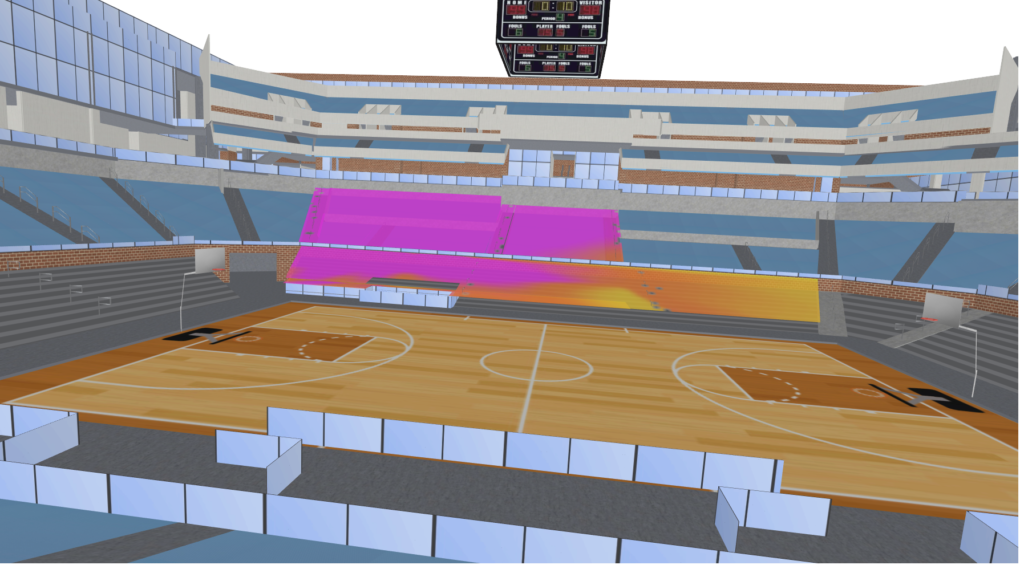
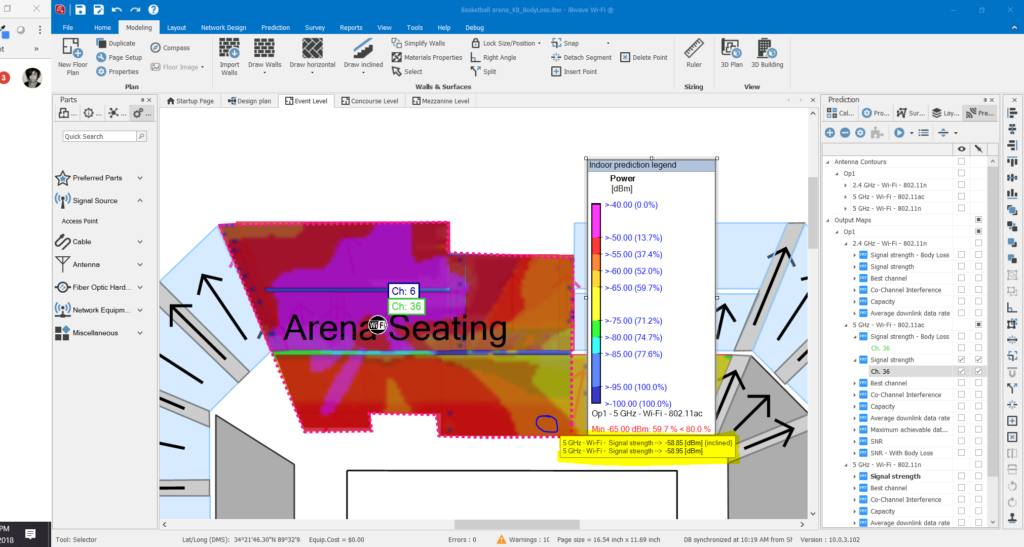
Keeping the prediction zone identified as a regular prediction area, I ran the Signal Strength and SNR heatmaps for the 5GHZ band and then used the “Probe” tool to zone in a very specific seating area in the bottom right hand side of the prediction zone (circled).
Here are the results.
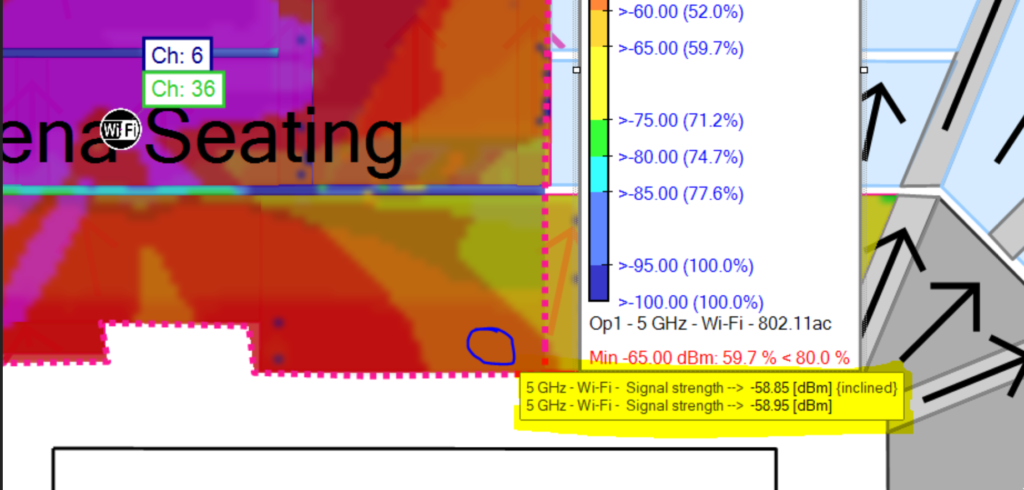
Signal Strength Heatmap Results
- 58.85 dBM {Inclined Surface Area}
- 58.95 dBM {Horizontal Surface Area}

And zoomed in… ?

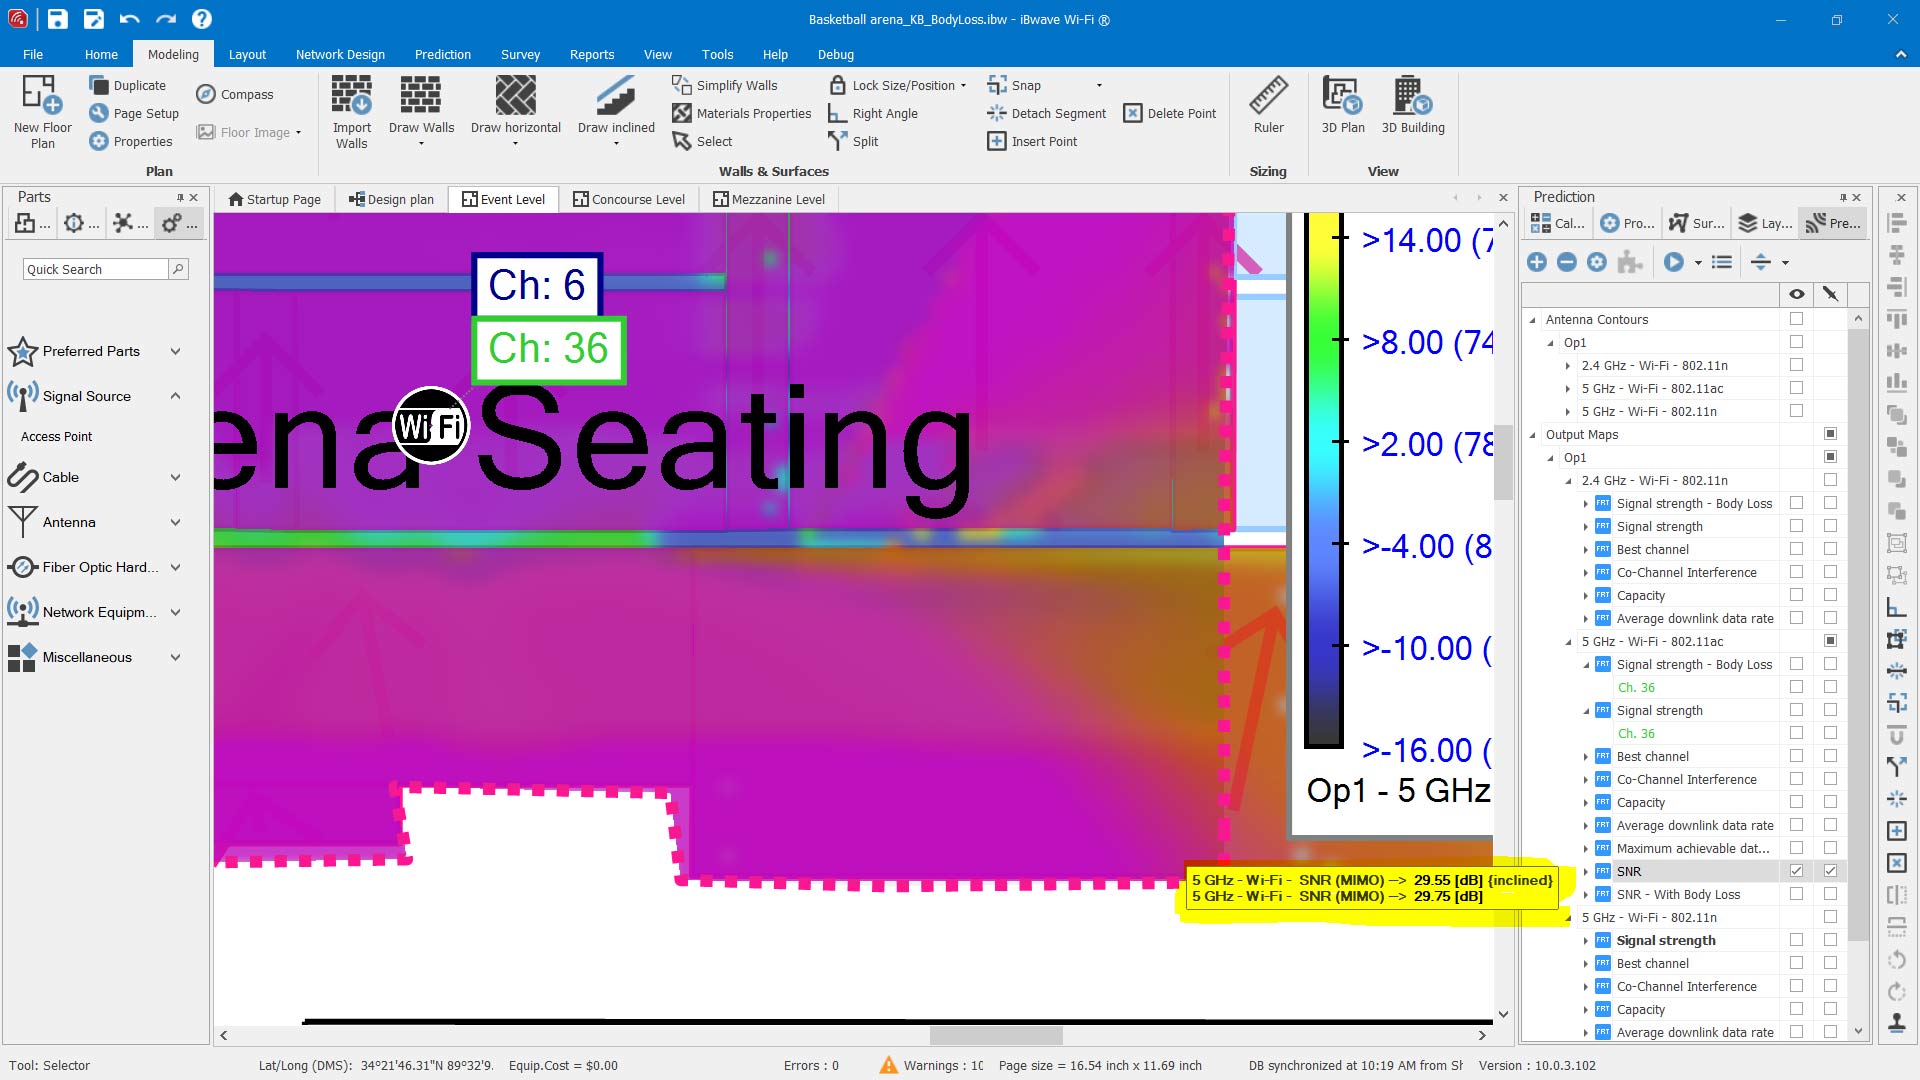
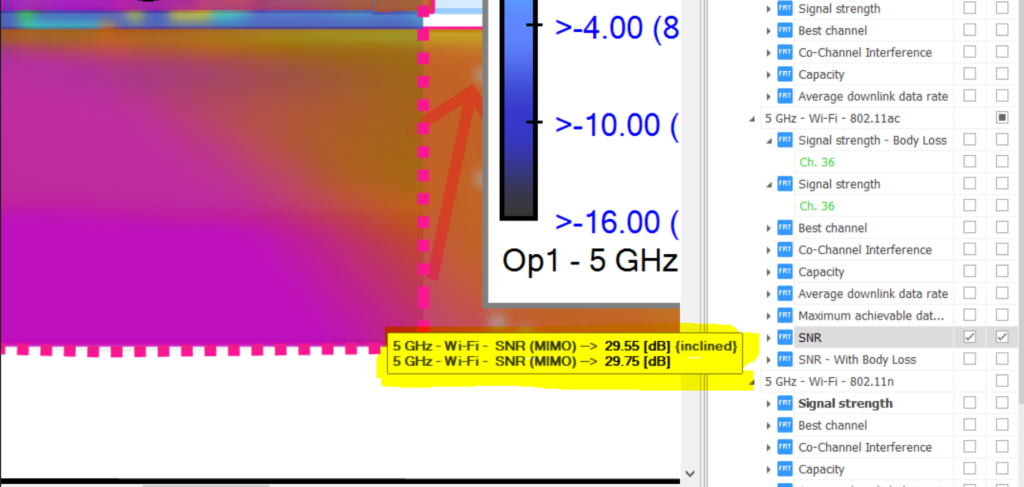
SNR Heatmap Results
- 29.55 dB (Inclined)
- 29.75 dB (Horizontal)

And zoomed in …?

Results: With Body Loss Modeling
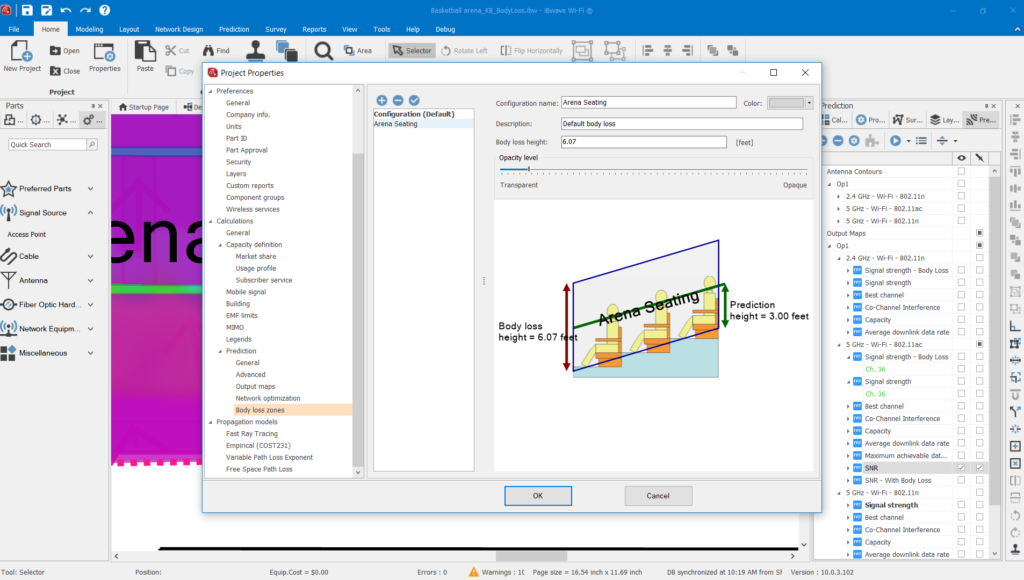
Next, I assigned the same prediction area as a ‘Body Loss Zone’ and then re-ran the Signal Strength and SNR heatmap prediction results. To identify a body loss zone in iBwave Wi-Fi or iBwave Design, you have to first configure the ‘Body Loss Zone’ (unless you just want to use the default), and then assign your prediction area as that particular body loss zone.
Here is the configuration I set up and called ‘Arena Seating’ ?

And here is how I assigned the prediction area as the body loss zone I configured above. ?

With the prediction area now identified as a ‘body loss’ zone, the prediction engine will factor in attenuation caused by tightly packed bodies within that seating area.
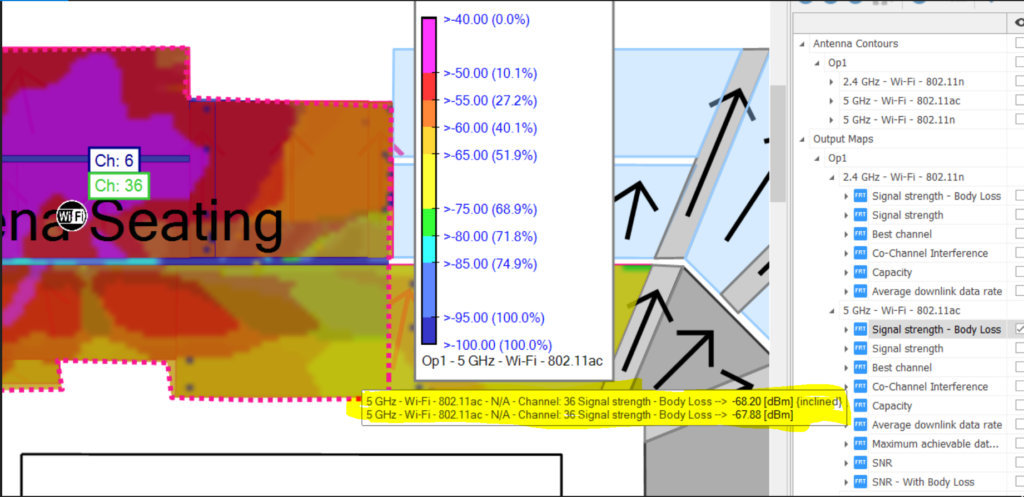
Here are the results ?
Signal Strength Heatmap
- Incline Surface: 68.20 dBm
- Horizontal Surface: 67.88 dBm

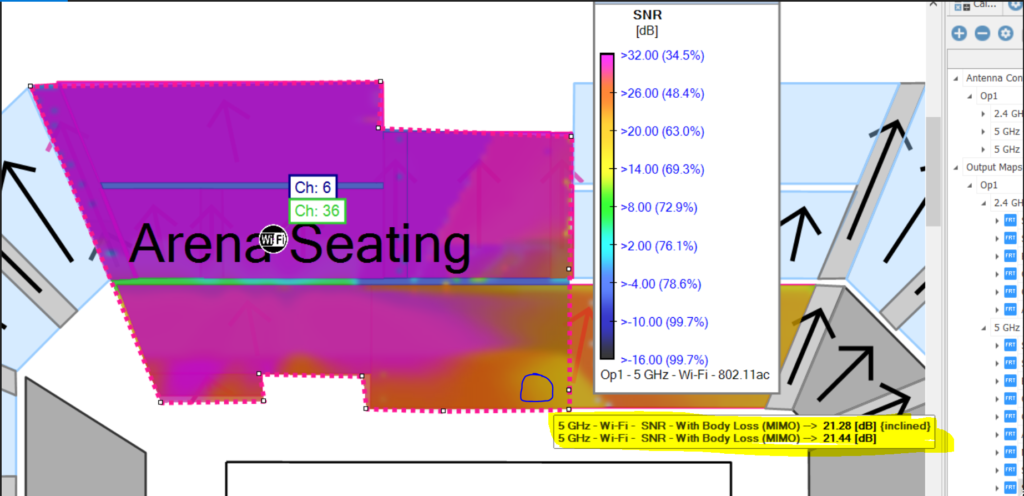
SNR Heatmap
- Incline Surface: 21.28 dB
- Horizontal Surface: 21.44 dB

Comparing Results
To easily compare the prediction results with and without body loss factored in, I put the results into a table.
| No Body Loss | With Body Loss | The Difference | |
| Signal Strength | 58.85 dBm | 68.20 dBm | -9.35 dB |
| SNR | 29.55 dB | 21.28 dB | -8.27 dB |
Looking at the table, you can start to see the potential impact that modeling bodies in high-density environments can have on the accuracy of prediction results – and thus on the potential performance of the network post-installation.
In this case, before I modeled body loss into the design, the signal strength is predicted to perform pretty decently with a 58.85 dBM signal strength. With the attenuation due to bodies factored in, the signal strength loses almost 10 dB, which pushes it towards a much less desirable signal strength and could significantly impact the user experience when it comes to critical applications like video streaming or VoWiFi.
Looking at the SNR heatmap, a similar story is supported, even emphasized – before body loss is considered, the SNR sits at a pretty acceptable level of 29.55 dB. After body loss is factored in, the SNR level drops to 21.28 dB – making it even more likely that those critical apps will work as expected for the user.
For the network engineer designing the network, this means she or he needs to factor in that while prediction results without body loss factored in can show acceptable performance results, it could be misleading in high-density venues – which can lead to undesirable and costly consequences later on.
When prediction during the design phase is not accurate, it can lead to more site visits post-install, and possibly re-design work which is all more downtime and cost for the property owner.
How do you factor in body loss into your wireless designs? Let me know in the comments below.
Wirelessly yours,
Kelly
Interested in learning more about iBwave Wi-Fi? Read more about it here, or try out a 15 day free trial.