The Internet of Things: An Overview

There are whispers of a powerful force in the wireless industry.

Warehouse machinery, electronic devices, factory equipment – all seemingly lifeless – are talking to each other. They’re organized. They’re connected. They’re powerful. They are…THE INTERNET OF THINGS!

Okay, when it’s put like that, the Internet of Things (IoT) sounds like a monster from a low-budget sci-fi flick. While it may not be the star of a monster movie, IoT lives up to its wacky name and then some.

So let’s put it in perspective: just what is the Internet of Things?

IoT is the extension of wireless connectivity into everyday objects. Embedded with electronics, internet connectivity, and other forms of hardware, these devices can communicate and interact with others over the Internet.

IoT continues to evolve thanks to the convergence of different technologies. Traditional fields of embedded systems, wireless sensor networks, control systems, automation, and smart buildings all contribute to enabling the Internet of things.

Simply put: IoT is how devices communicate and interact with each other through wireless technology. It’s becoming increasingly common in modern households: smart lighting, bluetooth speakers, automated locks, and more are all becoming essential parts of the home IoT ecosystem.

There are many different types of IoT technologies used today, each with unique standards, purposes, and benefits. Here’s a quick look at some of the most used:

  • 5G: The up-and comer. One of the newest IoT technologies, 5G brings low latency and can connect up to a million IoT devices per square kilometer. With high sensor density and efficient data throughput, 5G provides benefits to outdoor industrial IoT design that other technologies cannot.
  • BlueTooth: A proprietary technology owned by Ericsson, BlueTooth operates on a master-slave configuration and is commonly found in mobile devices such as smartphones and wireless speakers. While most know it for its application in personal tech, BlueTooth’s low power output also allows it to be used in sensor systems and medical equipment around the world.
  • LoRa: A proprietary technology owned by Semtech, LoRa is a highly secure IoT platform that can send encrypted data at various frequencies and bitrates. It can provide both indoor and outdoor coverage, and its application is found in offshore industries and the burgeoning ‘smart city’ sector .
  • ZigBee: A short range technology that offers benefits such as low power output, less expensive system implementation than other IoT types, and low battery consumption. Typically found in industrial applications and home products, ZigBee operates on the 2.4Ghz band.
  • WiFi: The head honcho. WiFi is the most popular IoT service used around the world, universally adopted for both commercial and personal connectivity purposes. With easy implementation, no spectrum costs, and cross-vendor interoperability, WiFi has become the go-to option for indoor IoT connectivity. Features such as targeted wake time and simultaneous data transfer for up to 18 users make it an appealing option for in-building wireless design.

You can learn more about other IoT technologies with our Wireless Standards Reference Poster.

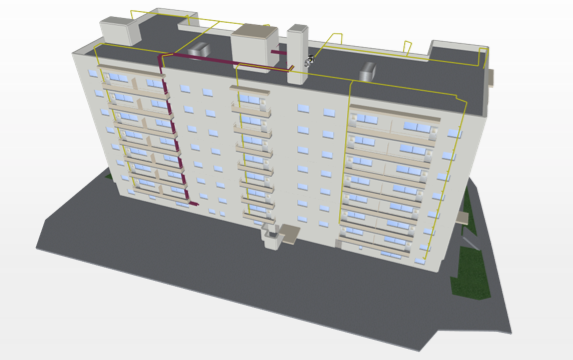
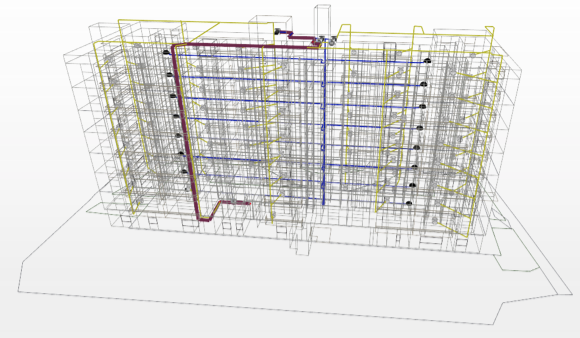
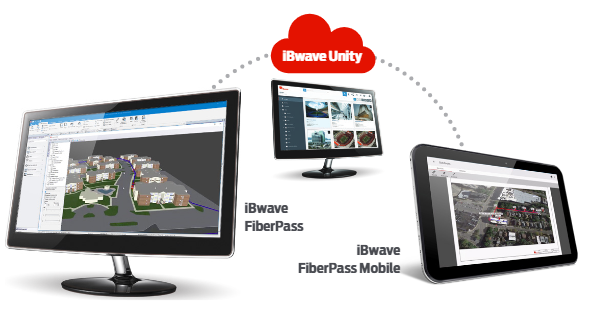
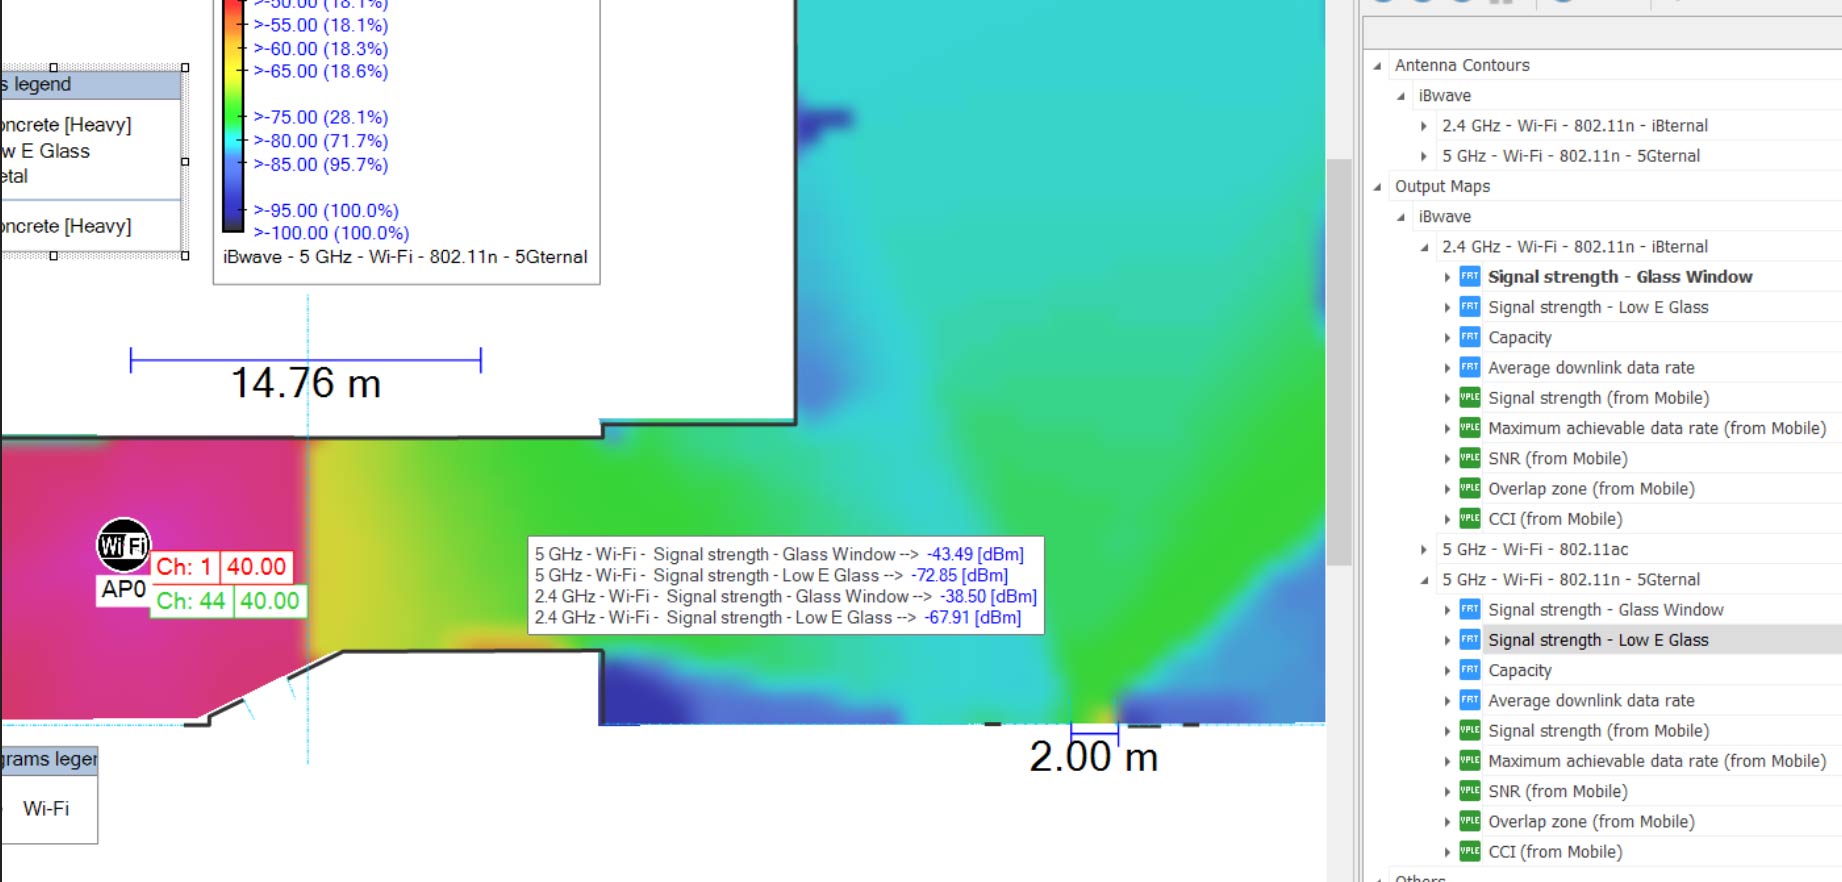
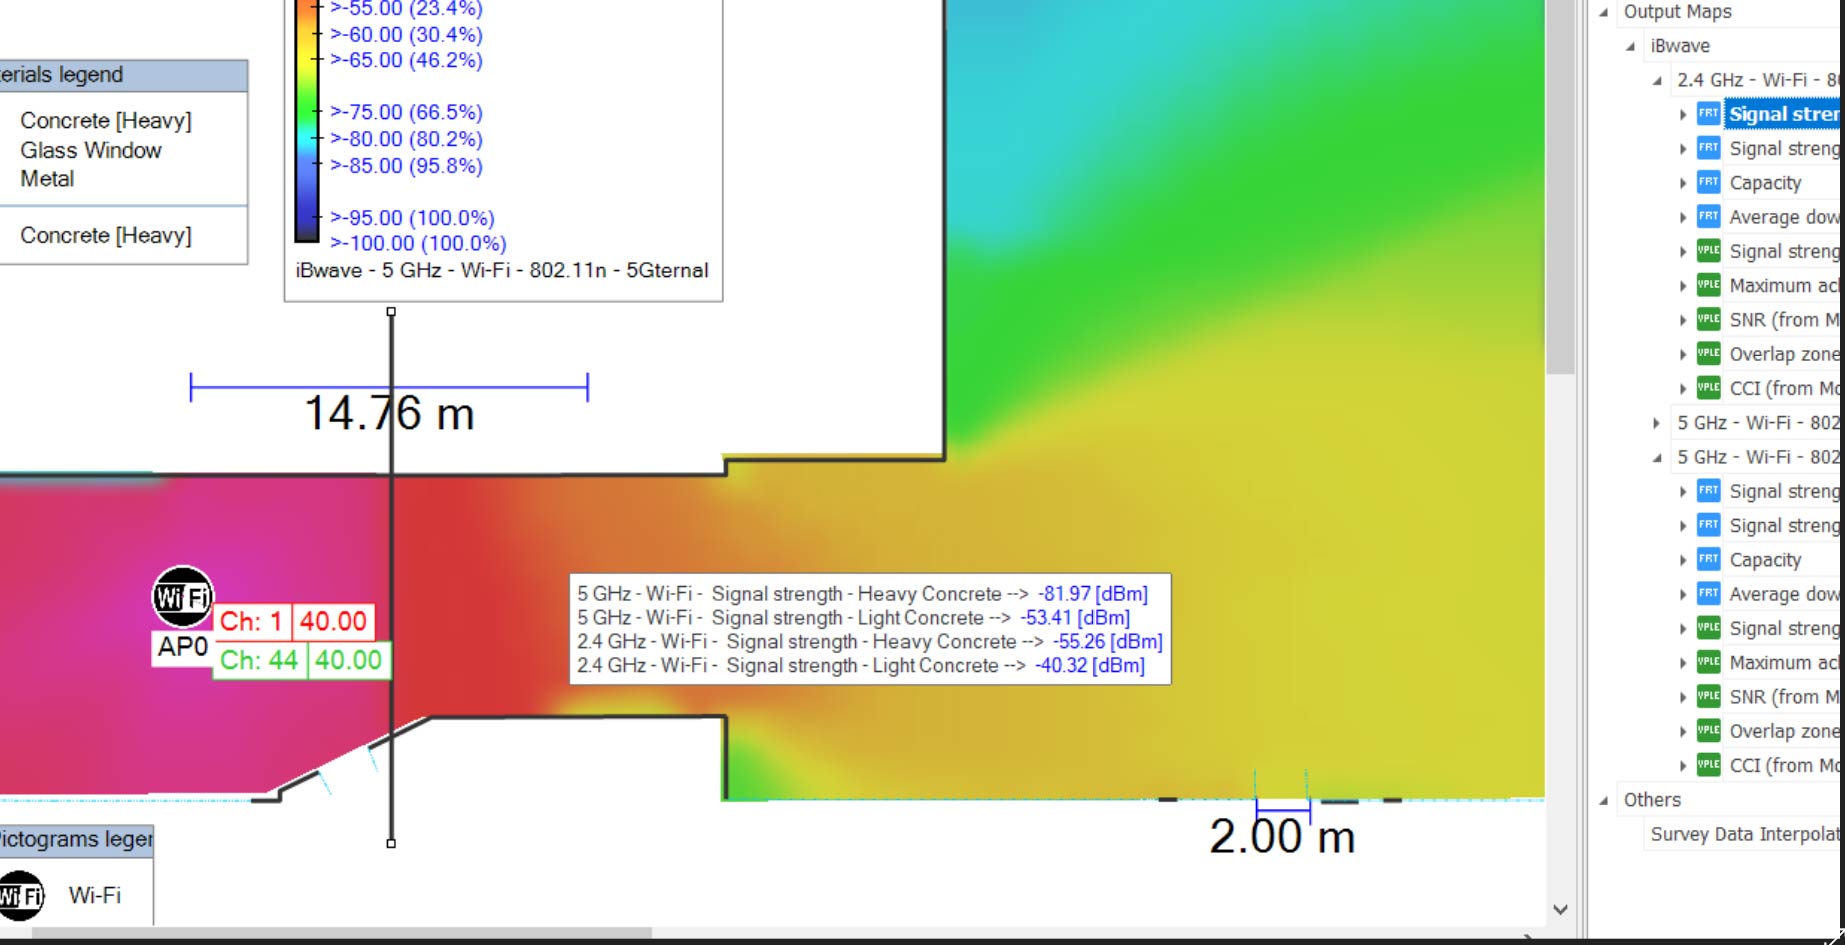
In the warehouse and factory industries, WiFi IoT design has been a mainstay of the production process for years. At iBwave, we’ve developed software that helps system integrators design wireless networks for these types of venues.

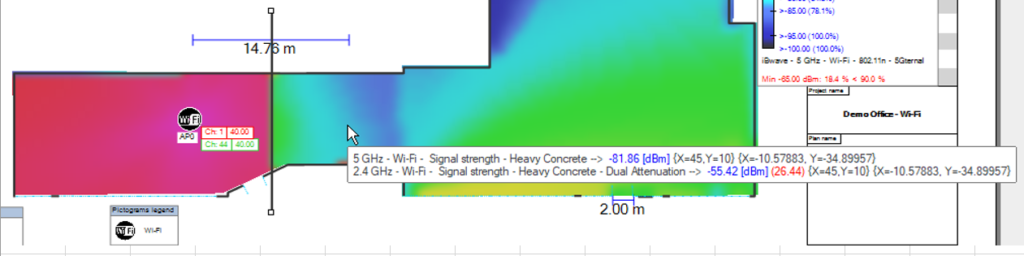
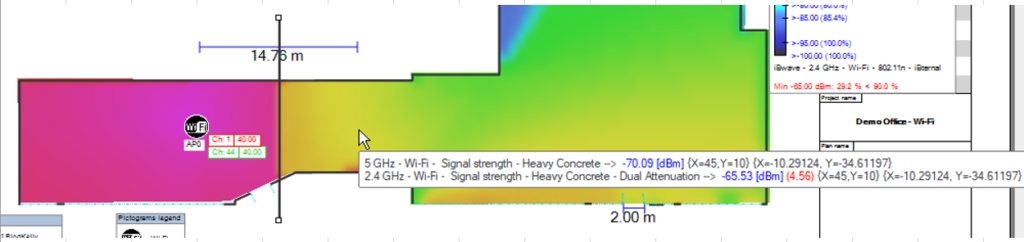
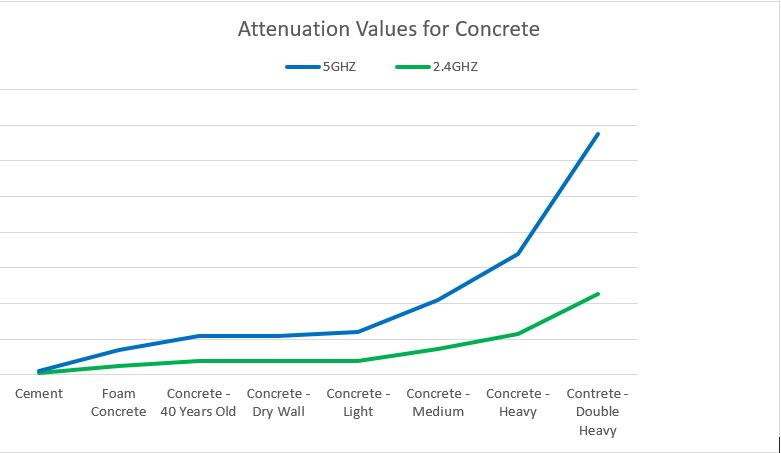
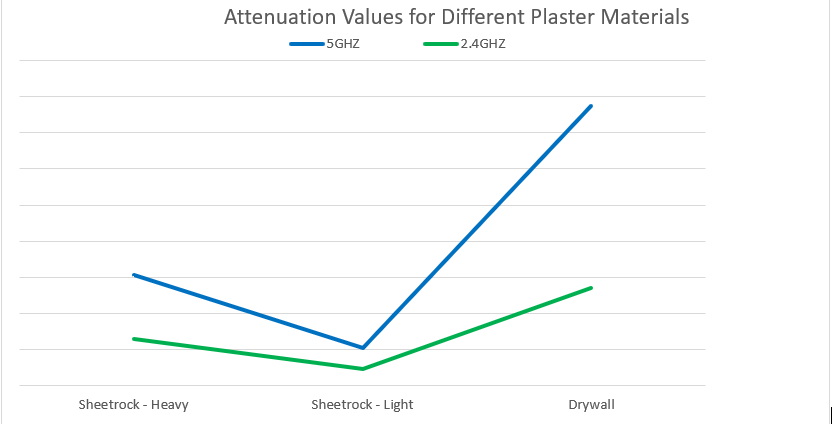
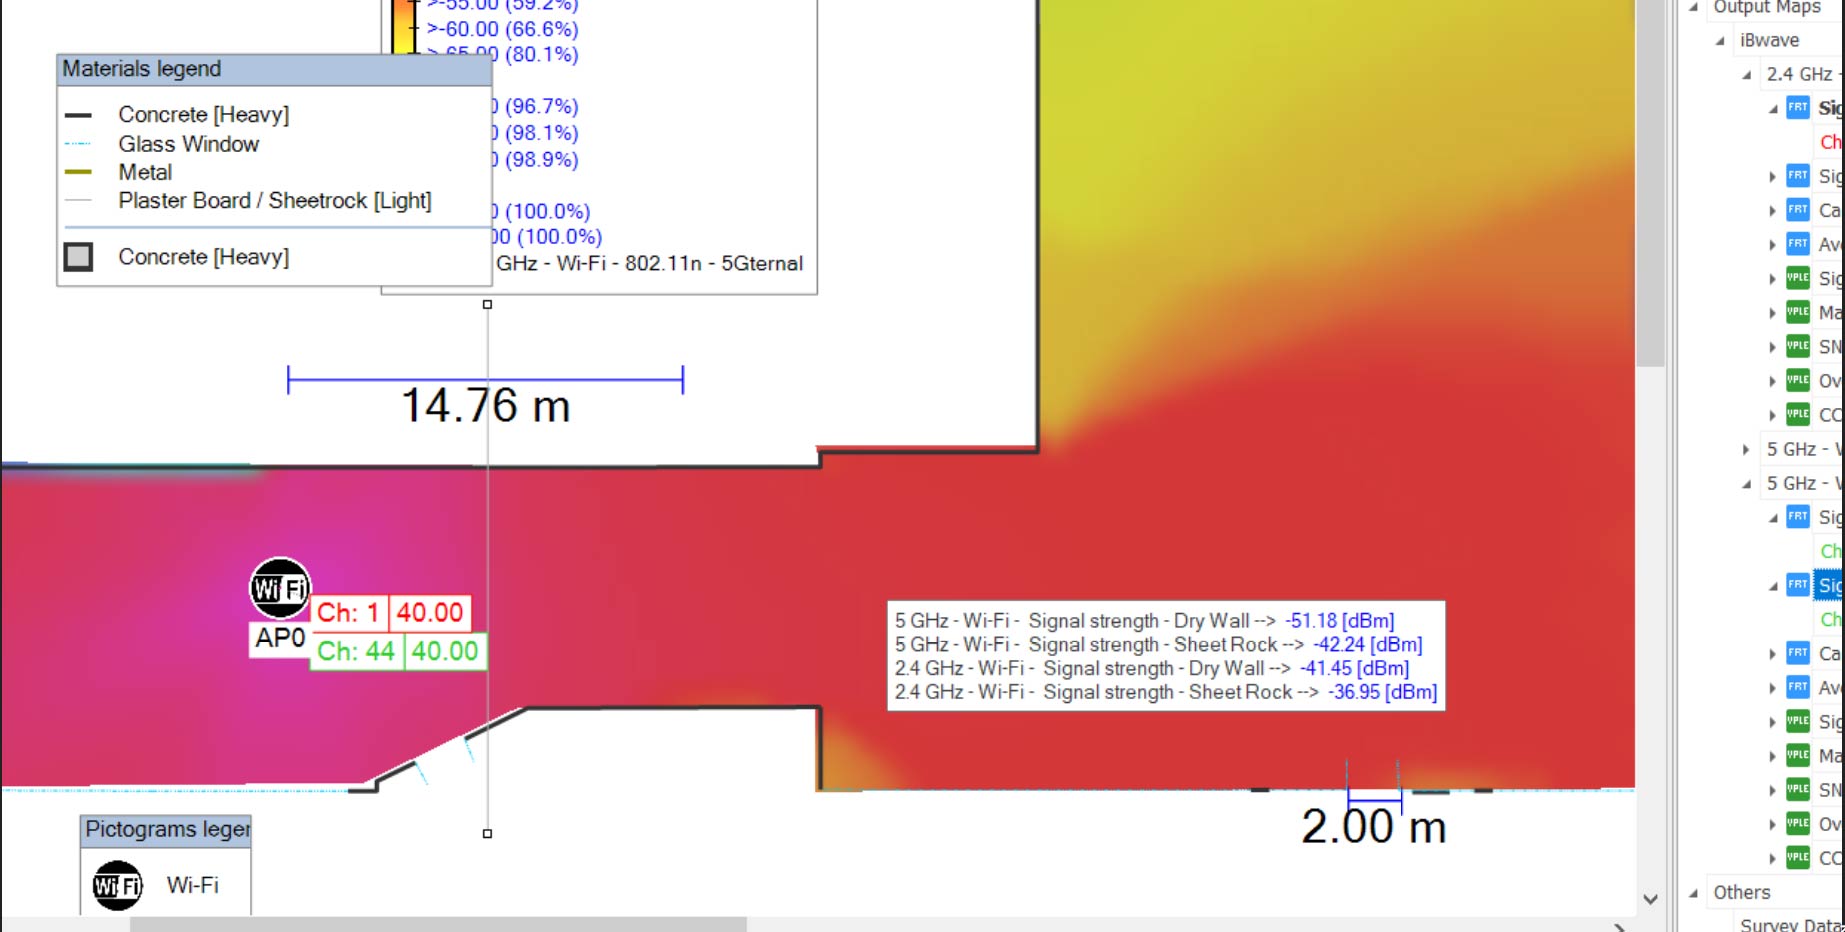
Warehouses present some unique challenges when it comes to IoT design. Tall ceilings, reflective surfaces, and shelves holding inventory can all negatively affect indoor signal strength. Spotty propagation can also occur through material interference from metal machinery.

With that in mind, here are some useful tips when designing and IoT network for warehouse:

  • Design For Worst Case Scenarios: Warehouses have ever-shifting inventory levels, and the density of product within a building can significantly affect signal strength. Site surveys should be conducted when shelves are full to ensure connectivity can be achieved even when there is a lot of potential signal refraction from warehouse stock.
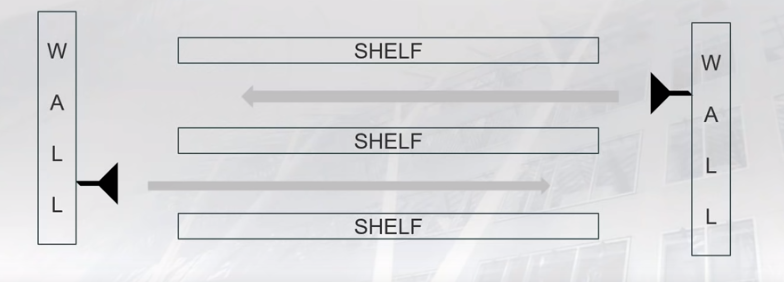
  • Stagger Your Antennas: Warehouse layouts typically consist of a series of tall shelves separated into aisles. To ensure the best possible connection, mount antennas to opposite walls of the warehouse, alternating between each aisle. This allows for connectivity throughout the warehouse without purchasing extra antennas.
  • Ensure You Can Connect Anywhere: Staggered antennas will help ensure connectivity between aisles, but since warehouse stock can be stacked up to 14 meters high, make sure your devices can connect vertically as well as horizontally. Inventory scanners are a crucial tool used in virtually every warehouse, and they need to be functional everywhere in the building.

We’ll cover IoT design tips and challenges for manufacturing plants in a future post.

And there you have it! We hope we’ve demystified the Internet of Things – we promise it isn’t hiding under your bed (or if it is, at least it’s there to connect your devices!).

For a more in-depth discussion on the topic, check out the IoT webinar presented by Dr. Vladan Jevremovic, the Director of Research at iBwave.

Thanks for reading!

How FiberPass Reinvents FTTH Design

We’re bringing the good fibes!

The demand for ultra high-speed wireless access in the home has never been greater. Major operators are rushing to deploy fiber to apartment buildings, townhouses, and residential areas around the world to satisfy the public’s appetite for breakneck internet speeds.

At iBwave we recognized this demand and recently launched FiberPass, an innovative design solution for fiber deployments in multi-dwelling units.

What exactly is FiberPass? It’s the go-to solution to dramatically accelerate design and deployment for Fiber‑to‑the‑Home (FTTH) network projects.

Developed with FTTH design principles in mind, and with input from major telecommunications operators, FiberPass has simplified the entire fiber deployment lifecycle – from initial design to follow up maintenance.

FiberPass Streamlines Every Step In The Network Design Process

Previously, the process for designing and deploying a FTTH network was cumbersome and time consuming. With go-aheads required from different project managers – from operators to property supervisors – past FTTH design projects spent months in limbo waiting for approval.

Property managers were concerned about the effect that FTTH deployment had on tenant disruption, building aesthetics, and time requirements. Each time a change was requested, a new approval was needed.

Before FiberPass, some buildings took up to nine months after initial design before the FTTH network was finally approved. Meanwhile, operators were sinking time and money into projects with no completion in sight.

To make matters worse, design software was also fragmented. Engineers were using a variety of programs and devices to perform site surveys and compile data. Without an all-in-one design solution, synchronizing, organizing and communicating project information posed a significant challenge.

To solve these issues, iBwave worked closely with operators and property managers to understand and ultimately come up with a solution. The result is FiberPass, a software solution that speeds up FTTH design time by 300%.

FiberPass changes the landscape of FTTH design in several ways, and the benefits start right from project conception.

When engineers use FiberPass on mobile to perform site surveys, they’re able to complete up to 80% of the design right on the tablet. With the ability to take photos and annotations while surveying, engineers can compile information for property managers about aesthetics, tenant impact, and unique challenges in a building’s design all in the same application. Best of all, FiberPass can generate beautiful 3D building plan virtualization, giving property managers a convenient and detailed look at the network design.

iBwave’s 3D Virtualization in Action

Once a site survey is completed, FiberPass can generate an electronic sign-off document to send directly to property managers for approval. If changes are requested, an engineer using FiberPass can often accommodate inquiries during the initial survey. That’s a dramatic change from previous design practices, where multiple surveys would need to be conducted before a project could move to approval and deployment.

That’s not the only way FiberPass saves time. There’s a host of built-in automated report generation tools to simplify FTTH design. The Bill of Materials, Approval Sign Off, and Equipment List reports can all be generated instantly to provide property managers with the information they need to validate a design. If an approver is offsite, iBwave Unity’s cloud connectivity ensures they’ll be still be able to immediately access any information shared by the engineer performing the site design.

The FiberPass Product Ecosystem

Fiber networks often require specialized equipment, but with over 22, 000 vendor modelled parts and the option to add more as needed, iBwave’s component database has you covered. Being able to easily find the part needed to complete an FTTH design without leaving the application has a huge impact on efficiency and shortening design time.

How does all this time-saving add up? Since adopting FiberPass, operators have been able to:

  • Remove 4 day backlogs after site surveys (From 4 days to 3 hours)
  • Remove 6 day backlogs during Design process (From 6 days to 7.5 hours)
  • Reduce time to approval from 15 hours to 3 hours

We’ve barely scratched the surface of all the great features included in Fiberpass. To learn more about all the things the software is capable of, check out the FiberPass product page.

Thanks for taking the time to learn more about FiberPass and FTTH. Let’s keep spreading the fibe!

Exploring Attenuation Across Materials & the 2.4GHZ / 5GHZ Bands

A Twitter post popped up in my news feed last week showing a graph of the attenuation values for different types of glass – mainly the distinction between a regular glass window and a low emissions (Low E) window. It was showing that Low E windows have a much higher attenuation value than regular windows—a fact that could impact prediction of a network significantly if the incorrect type of window is selected during modeling.

Turns out, it’s not so uncommon when looking across the different types of materials in ‘material families’ like glass, concrete, plaster, and wood – especially the heavier varieties. While looking into these different materials, I also started to see a trend amongst the ‘heavier’ types of materials like concrete—that attenuation values can even be different within the same material when comparing signal loss for 2.4GHz vs. 5GHz bands.

 2.4GHz Transmission Loss Value for 40 Yr Old Concrete ?

 5GHz Transmission Loss Value for 40 Yr Old Concrete ?

For many WLAN designs, this may not be such an issue because attenuation is often measured on-site using an AP on a stick – but what about for Greenfield buildings? Or when just providing a quote? Or doing a strictly predictive design? In these cases, there may be no walls to get the on-site readings or going on-site may just not be a possibility at that point in the project.

In this blog I look at two things:

  1. The difference in attenuation across the 2.4GHZ and 5GHZ bands for the same material, and the potential impact on prediction accuracy
  2.  The difference in attenuation values for materials in the same family, and the effect of selecting the wrong material when modeling.

Attenuation: Differences Between 2.4GHz & 5GHz Bands

As mentioned above, as I was looking at attenuation values through different types of materials I realized that there are quite a few ‘heavy’ materials that have significantly different attenuation values for the 2.4GHZ and 5GHz bands.

Some examples of significant and not so significant differences:

 2.4GHz (dBm)5GHz (dBm)
Concrete – Heavy22.79244.769
Lime Brick4.2957.799
Dry Wall Partition5.38810.114
Chip Board0.4630.838

As  it’s well known from theory and practice of radio propagation, as frequency increases, path loss increases. With materials, very similar thing happens – as frequency increases from 2.4GHz band to 5 GHz band, transmission loss will also increase. For example, using the concrete heavy example in the table above and imagine there is a concrete heavy wall between the AP and the client. At 2.4 GHz, the transmission loss is ~23 dB- meaning that as the signal goes through the wall it is decreasing by that amount of attenuation. Now if the operating frequency is changed to 5 GHz, the transmission loss is going to be higher because the frequency is higher – so in this case it goes to ~45 dB. This is most often the case with heavier materials, and although a difference can be seen in lighter materials, it would not have as much potential impact on prediction.

To illustrate this, I ran a prediction just showing the Free Space Path Loss for a single AP on 2.4GHz and 5GHz bands. In it the results show:

  • 2.4GHz: -33.46
  • 5GHz: -28.9

So with no obstruction, there is about a 4.57 dB difference in attenuation between the two bands. 

What’s the Potential Impact?

Next I wanted to look at what happens when there is an obstruction (in this case a concrete wall) and the potential impact on prediction results in this case. 

Adding a ‘Concrete-Heavy’ wall with the following attenuation values, I re-ran the signal strength heatmaps.

  • 2.4GHz : ~23 dBm
  • 5GHz : ~44 dBm

And got these results:

  • 2.4GHz: -55.42 dBm
  • 5GHz: – -81.86 dBm

To compare what would happen if I just used one attenuation value, I created a custom material by duplicating the ‘Concrete-Heavy” and assigning it just one attenuation value of ~33 dBM (the average of  the values for 2.4GHz & 5GHz above).

The results for that were:

  • 2.4GHz: –65.53 dBm
  • 5GHz: –70.09 dBm

From results (summarized in the table belowe),  it is seen that when we apply two values – one for 2.4Ghz and  one for 5GHz bands (23 dB and 44 dB), the difference in prediction between the two bands is significant. This difference is as expected because the heavy materials would have more attenuations in high frequency bands. However, when we apply only one value (33 dB) for the material that represents both bands, it’s noticed that the difference between the two bands is not significant (which it should be). 

Different Attenuation Values Across the Same Family of Materials

Next let’s look at the different attenuation values found within familes of the same materials. 

Staying focused on materials commonly used when modeling a venue, a couple of ‘material families’ started to stand out to me when looking at the range of attenuation values across the different types: Glass, Concrete, and Wood.

Glass

In the iBwave database of components, there are several different types of glass listed for used during modeling:

  • Electronic Equipment Glass
  • German Mirror Glass
  • Glass from Jena
  • Glass Window
  • Low E Glass
  • White Ceramic

Plotting their attenuation values from lowest to high, for both 2.4GHz and 5GHz bands, you get something that looks like this ?

Concrete

Perhaps one of the most common modeling materials is concrete – but when you start to look across the different types of concrete, including the age of the concrete, the attenuation values do not always look the same.

In our database, we list several types of concrete, here are a few that I looked at:

  • Cement
  • Concrete – 40 Years Old
  • Concrete – Double Heavy
  • Concrete – Dry without Steel
  • Concrete – Dry Wall
  • Concrete – Heavy
  • Concrete – Medium
  • Concrete – Light
  • Concrete – White Wall
  • Foam Concrete

That’s a lot of concretes to choose from when modeling – and when you look the range of attenuation values across them all, you can start to see why it would be important to model with the right concrete. ?

Plaster

In the database of materials, here are the different types of plaster you can choose when modeling the venue.

  • Drywall
  • Sheetrock (Heavy)
  • Sheetrock (Light)
  • Plaster Board / Ceiling Tile

And here’s what the different attenuation values look like compared to one another.

The Impact on Prediction

With that information, I started to wonder what the impact on prediction accuracy could be if a designer selected, say regular glass for a window when really it should be a low emissions glass often used now for newer buildings. Or what would happen if the venue was modeled with regular Concrete vs. older concrete for an older building – same with wood, what happens if the chipboard is used instead of particle board?

Let’s look at each of those scenarios and see what the potential impact on prediction accuracy could be.

Glass vs. Low E Glass

Using the floor of a regular, small, office space, I first ran prediction using the regular Glass for the windows and then replaced it with Low E glass to see what impact it would have on prediction were the wrong type of glass selected during modeling.

Results

 Glass Window (dBm)Low E Glass (dBm)Delta (dB)
2.4GHz-38.50-67.9129.41
5GHz-43.49-72.8529.36

Visual of the Different Signal Strength Heatmap Results

 You can see that in this case, using regular windows to model and design with when the windows are Low E windows, could be a very costly mistake – in both network performance, and the cost to troubleshoot it post-installation.

Heavy Concrete vs. Light Concrete

Next, I ran the same test, this time using two types of concretes, this time less extreme in attenuation differences: heavy concrete vs. light concrete.

 Light Concrete (dBm)Heavy Concrete (dBm)Delta (dB)
2.4GHz-40.32-55.2614.94
5GHz-53.41-81.9728.56

Visual of the Different Signal Strength Heatmap Results

Plaster

And last but not least, I tested the same scenario selecting Dry Wall vs. Sheetrock (Light) to see what the potential impact on prediction might be – and while not as drastic a difference in this example, a difference can still be noticed, more so on the 5GHz band. 

 Dry Wall (dBm)Sheetrock (Light) (dBm)Delta (dB)
2.4GHz-41.45-36.954.5
5GHz-51.18-42.248.94

Visual of the Different Signal Strength Heatmap Results

In Conclusion…

It was fun to dive into the attenuation values a bit more and how they can potentially impact the network prediction results of a network design.  And in fact, it is part of the conversation many of our customers talk to us about when it comes to modeling accuracy – the more accurate the modeling is, including materials and attenuation values, the more accurate the design and prediction results will be.  One of our customer CTS, discussed this point among a few others in a previous blog post about how modeling errors can lead to RF performance and cost issues. 

Read: How Poor Modeling Can Impact RF Performance and Costs

If you made it this far, I hope you found it interesting – let me know if you have any comments or questions! 

Wirelessly yours,

Kelly

Exit mobile version