A Tour of iBwave Viewer

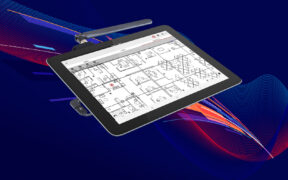
Available for many years and compatible with all our software, iBwave’s free read-only viewer is a popular go-to for the customers of our customers to review survey and design work done on their projects. In this blog I’ll take you on a quick tour of what it can do.

An Overview of iBwave Viewer Features

When you open iBwave Viewer it looks similar to other iBwave software – similar interface, similar menus – but functionality itself is limited to read-only. But this doesn’t mean the customer can’t do anything with it – it just means access is limited.

Here are the features I cover in detail below.

  • Reviewing Designs in 2D & 3D
  • Generating Reports
  • Analyzing Survey Data

Reviewing Network Designs

With iBwave Viewer, you can review any iBwave design as read-only in both 2D and 3D. For many customers, the ability for their customers to view the design in fully 3D gives them the benefit of a powerful visualization showing both exactly where location will be placed within the venue, as well as a strong visual of how the network will perform. For those who are not technically trained in RF, the ability to see their venue in 3D, to see where radios, cabling and network equipment will be placed is a powerful visual to gain approval faster.

As an example, here I open a warehouse design and you’ll see I can’t do anything to the design but I can view the overall design plan (network diagram), view the design in 2D, view any images/videos/notes saved to the pushpins, select and view different heatmaps and then generate a 3D visualization of the design/heatmap to “walk through the building”.

Generating Reports

While those using iBwave Viewer cannot make any updates to the design, they can generate a limited number of reports which may be relevant for their review. Specifically, they have access to generate and export the following reports:

  • Compliance Report
  • Equipment List (Bill of Materials)
  • Output Maps Report
  • Survey Data Reports
  • Annotations Reports (handy for installation team to review)
  • Area Report

In this short video I generate the BOM, Compliance Report and Output Maps report.

Analyzing Survey Data using iBwave Viewer

With iBwave Viewer you can also view and analyze survey data for both Cellular and/or Wi-Fi, depending on what you collected during the site survey. Survey analysis capabilities include the ability to view the survey interpolation heatmap (separate from prediction heatmap), and then filter and view data for single, multiple or all SSID, BSSID or Channels. You can also run a survey data report for selected buildings, floors, SSIDs and bands. This is perfect for those who just use our latest survey app – iBwave Mobile Survey – to only do surveys with but do not have accompanying software to review and analyze the data. With the free viewer they can simply import the data and use Viewer to analyze it with.

In this video I walk you through the above, showing an example of a 5GHz survey trace.

Want to Try It Out?

iBwave Viewer is free and readily available on our website (with sample projects) for free. Give it a try by downloading it here.

That’s it, hope you enjoyed the blog!

Wirelessly yours as read-only,

Kelly

Introducing Augmented Reality in iBwave Wi-Fi Mobile

Some of you already know we’ve been playing with the idea of how to use Augmented Reality in the wireless network design process for the last little while. It’s been a fun innovation project to work on and a fun one to show people along the way at various conferences and events.

But we wanted to do more than just show a prototype, we want to get it in our customer’s hands to see if there is value and if we’re on the right track. So with that thought, we’re very happy to announce we’ve taken the next step on this AR journey and have released a few AR features as a beta in our most recent release of iBwave Wi-Fi Mobile. Why beta? Well, we have these features developed—and while they might not be primed and polished for the big time—we’re at the point where the innovation team (CTCM) wants to get some real feedback on the value of AR in the network design lifecycle. But we also want to source new ideas from our customers to involve them in the innovation process. Where and how else could AR be used? There are probably many use cases out there and we want to hear what they are beyond just the few we’ve worked on.

Here’s an overview of the features we’ve released and how we see them being used.

The Features

Survey Interpolation in AR

With iBwave Wi-Fi Mobile you can already collect survey data on-site and then run interpolation to get a full understanding of what the existing coverage looks like as a heatmap – which could be useful for both a pre and post-install site survey. With the AR release, you now have the option to view the existing coverage in AR as you walk the site. This can be valuable for yourself, but also for your customer who may not have the same technical understanding of heatmaps as you do. It gives you a very powerful visual to show to your customer on-site at the survey. When you are viewing in AR there are a number of different ways to view the heatmap graphically (wave, cubic, flat) and there are various ways to filter what you are looking at so you can opt to focus on just particular areas. For example, you can focus on just low-signal areas or just high-signal, filter to view only areas above or below a certain dB threshold or other areas as it makes sense.

Here’s a short video showing the interpolation heatmap after a survey.

https://blog.ibwave.com/wp-content/uploads/2020/09/ar-si-wifi-2.mp4

Prediction Heatmaps in AR

With this release of the AR features, there are two ways to view prediction heatmaps.

RSSI Heatmap in Mobile App

To test the value of viewing prediction in AR, the team started with just the ability to view the RSSI heatmap in AR to understand the predicted coverage of a Wi-Fi design done on the mobile app. Viewable for either 2.4 or 5 GHz, the RSSI heatmap can give you a powerful visual to use to show your customer what the predicted coverage will be of the design. This can be helpful for gaining customer approval quicker and of course, just to impress them with the visual.

Other Heatmaps

While you can view the RSSI heatmap from the mobile app, it’s also possible to export any heatmap from iBwave Wi-Fi PC and show it in AR on your mobile app as well. While a more manual task – the benefits are that it will show you a more accurate prediction since it was calculated in the PC using 3D modeling, fast ray tracing algorithm and calibration. It also enables you to show many other heatmaps outside of just signal strength. Once we get a better understanding of the value of predictive heatmaps in AR, we’ll look at adding additional ones to be native within the mobile app.

Here’s a video showing the RSSI Heatmap from the mobile app.

https://blog.ibwave.com/wp-content/uploads/2020/09/ar4.mp4

Locating Equipment in AR

The last feature and use case is locating the Access Points and equipment you’ve designed in iBwave Wi-Fi Mobile in augmented reality as you walk the floor to validate the design installation. This could be useful to validate the installed location of the equipment, or it could be useful for future troubleshooting – especially where it’s the case the AP is not visibly installed. With the mobile and design plan in hand, you can walk the building and the equipment will appear in AR where you can view useful information about it. Curious to get feedback on this one – what information would be most useful to have?

Here’s a short video showing both the cable routing and where the APs are located in the design. You can see for the first AP the actual install is not exactly where it should be according to the design, whereas the second one is correctly installed.

https://blog.ibwave.com/wp-content/uploads/2020/09/equipmentlocation.mp4

What’s Next?

That’s a good question. We really consider this release a technology preview – a way to get further feedback on the use cases we’ve thought of, but also to brainstorm other ideas with our customers. Plus if you’re like me, you will think it’s just a fun feature to play with. Many times I’ve heard ‘we would love some RF goggles’ – and well, so far this is as close as we can get to that.

What do you think? Are these features useful? What else do you see AR being used for when it comes to wireless network design? Where would you like to see us take this?

Wirelessly yours,

Kelly

What’s New in iBwave Wi-Fi 14.2

Did you see the latest news for iBwave Wi-Fi? It’s got a couple of new features we’re excited to let you know about.

Zigbee Support in iBwave Wi-Fi

Zigbee uses IEEE’s 802.15.4 network standard to communicate with other Zigbee devices and like Wi-Fi devices, works on the 2.4 GHz band. And while we’ve always supported Zigbee in our iBwave Design product – the fact that it operates on the 2.4 GHz band just made it logical for us to also include it in our iBwave Wi-Fi product. With this functionality, it now gives our customers an IoT design option in iBwave Wi-Fi.

Here is an example of a Zigbee predictive design done in iBwave Wi-Fi and the different output maps you can use to view it’s predicted performance.

Mist Integration

For customers using Mist APs to design their Wi-Fi networks, we have some good news. With this release comes the ability to export your iBwave design and then easily import it into your Mist dashboard for a much more streamlined deployment process. Within the Mist dashboard you can now see AP information such as model, location, ID, high, direction, etc as well as Floor plan information and image information.

Note: This feature is also included in iBwave Design for our customers who use it to design Wi-Fi networks.

“With the ability to import iBwave files directly into Mist, it gives one source of truth and eliminates duplicate work. You design in iBwave and then the work and design details just get carried into Mist giving the user a very streamlined deployment workflow.”

Wes Purvis, Product Manager, Mist

Exit mobile version