
How to Design Wireless Network for Stadiums: Key Insights and Strategies
Share

Designing wireless networks for stadiums (and for mass events in general) presents unique challenges and opportunities. As network traffic surges during events, it’s essential to ensure that users experience seamless connectivity. This blog will delve into the critical aspects of stadium network design, exploring the intricacies of cell deployment, throughput optimization, and practical strategies for effective network planning.
Key Challenges in Stadium Network Design
Stadiums pose significant challenges for network designers, including dense user populations, fluctuating traffic patterns, and complex architectural layouts. These factors require innovative approaches to ensure reliable connectivity and optimal performance during events.
- Dense User Populations:
Stadiums attract large crowds, leading to high concentrations of users that strain network capacity. Designing networks capable of handling simultaneous connections from thousands of users is essential for maintaining seamless connectivity. - Fluctuating Traffic Patterns:
Network demand in stadiums varies widely, from intermittent spikes during peak moments to sustained high usage throughout events. Predicting and managing these fluctuations is crucial to prevent network congestion and ensure consistent service quality. - Complex Architectural Layouts:
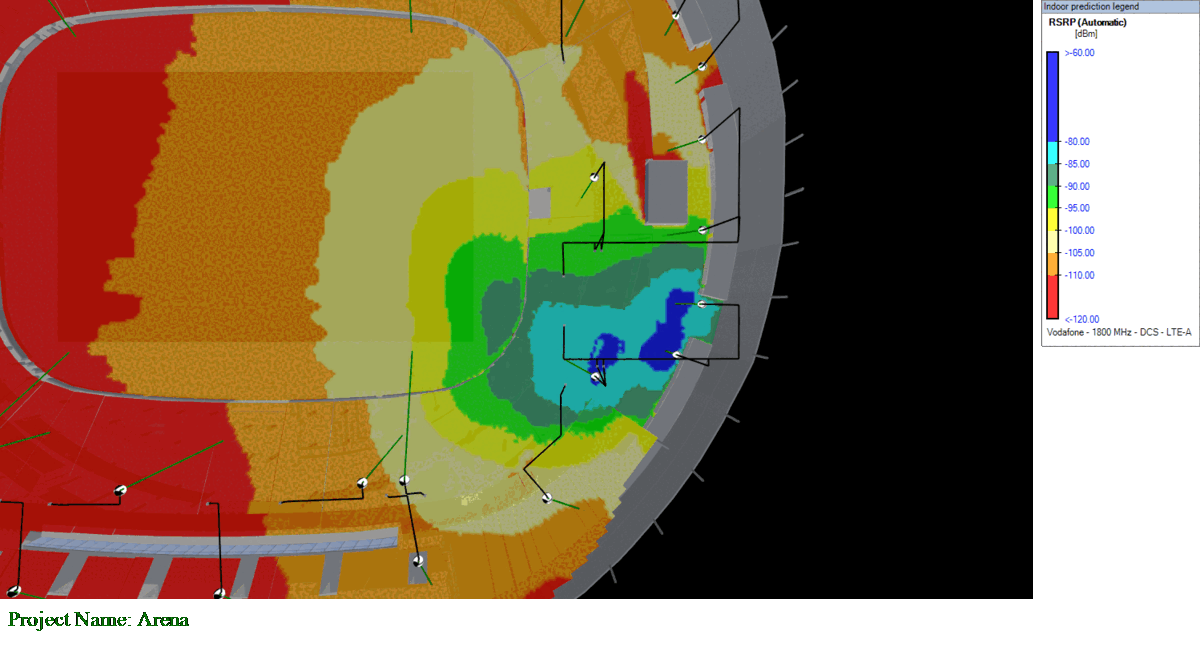
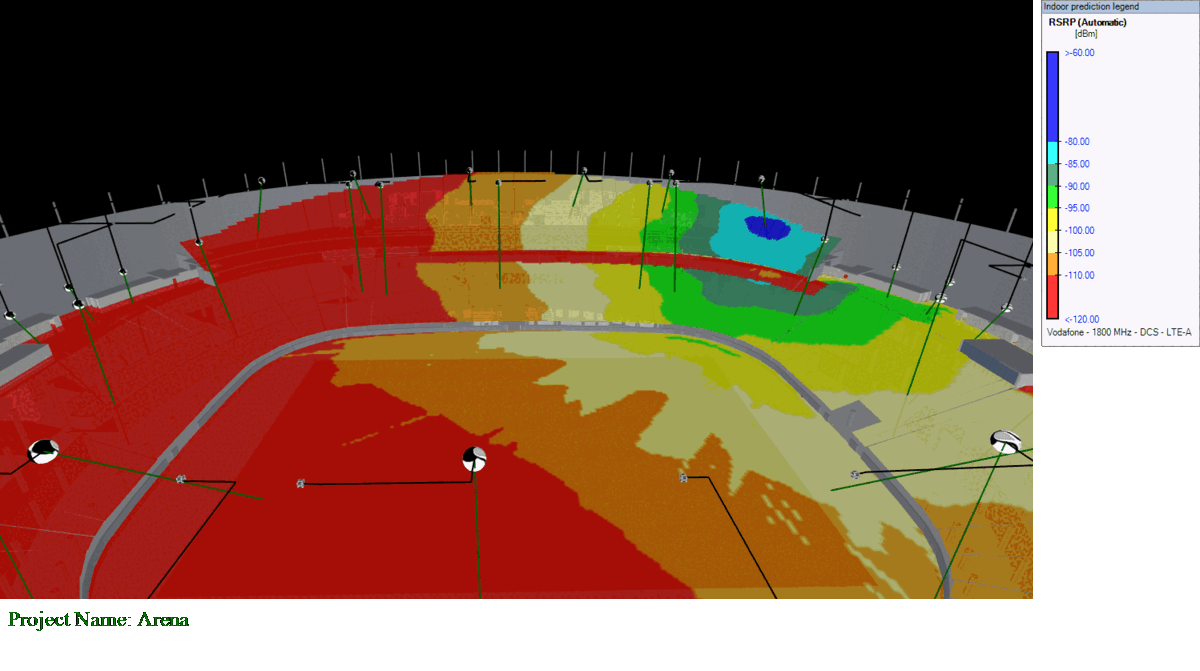
Stadiums’ structural designs, with reinforced concrete, steel frameworks, and expansive seating arrangements, pose challenges for signal propagation and coverage uniformity. Effective network planning must address these architectural nuances to provide comprehensive coverage across all areas. - Transition Zones, VIP Zones, and Fan Zones near the Stadium:
There is a need to integrate RF coverage for those in common RF design to avoid mutual interference and align radio network capacity. - Weak Sector Isolation (RF) / Weak RF Isolation:
Physical nature of RF propagation àReflections, Diffraction, Diffusive Scattering as well as direct out-of-main lobe emissions of RF energy limit sectorization options and achievable Arena/Stadium capacity. Unwanted RF energy is spilling over on other cells. The effect is always observed for any existing antenna, but intensity can be controlled and assessed.
Typical OUTLOOK for RF Design on a football stadium:
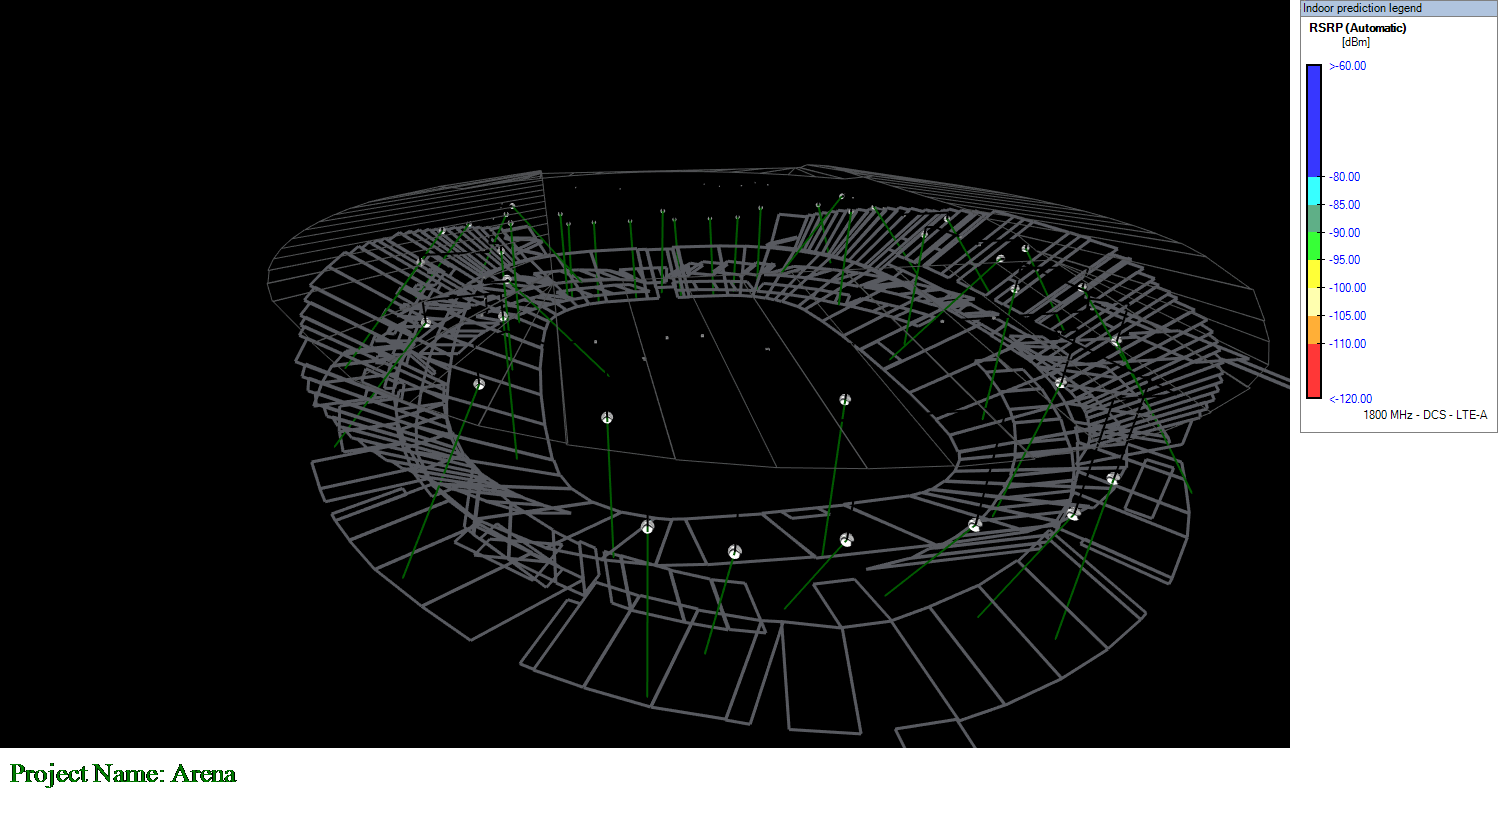
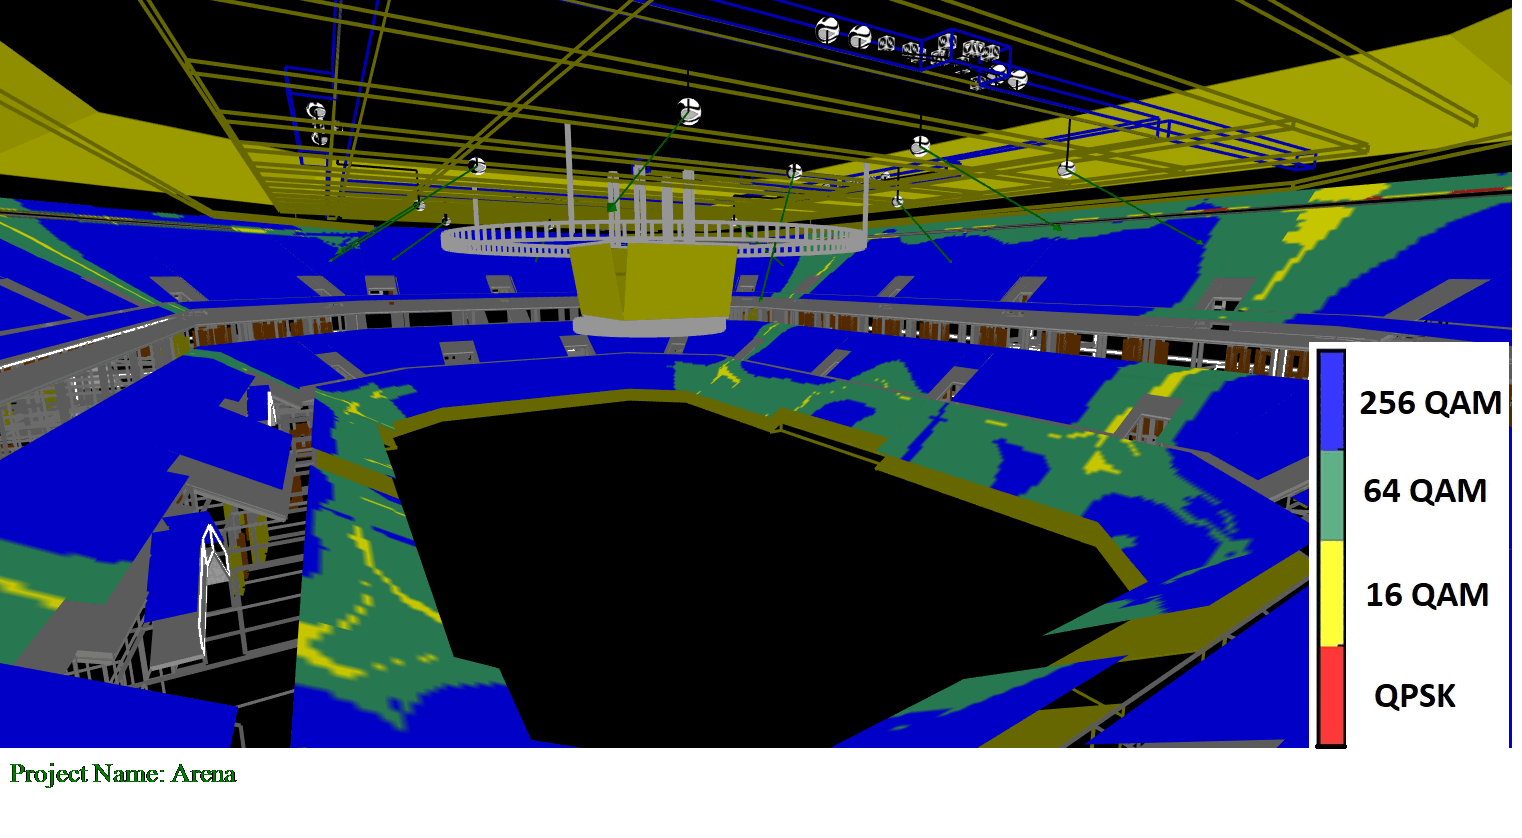
Weak RF isolation shrinks Higher Order Modulation Footprints during a game. Of course, weak RF isolation also exists in the UL direction. Focused work with antenna positions and patterns can help minimize the degradation of 256 QAM footprints (under load) in case of a higher number of cells deployed.
Successfully addressing these challenges requires a deep understanding of stadium dynamics and the implementation of advanced network planning strategies. By leveraging advanced solutions and strategic deployment, network designers can create robust networks[DS1] against interference and high load that meet the demanding connectivity needs of modern stadiums.
Understanding Throughput and Cell Deployment
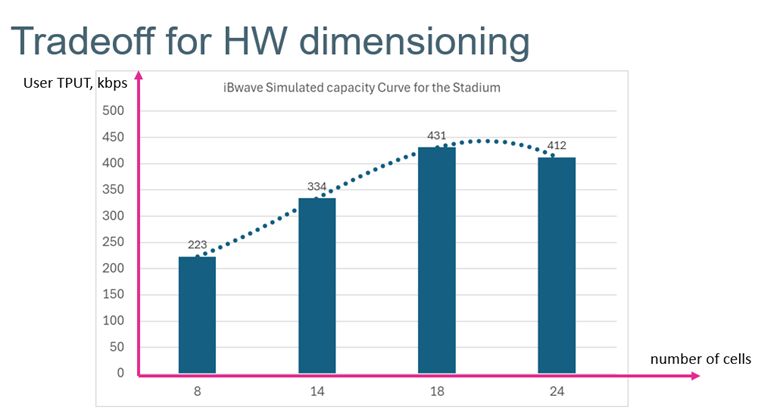
When designing a stadium’s cellular network, one of the primary considerations is throughput—the rate at which data is successfully transmitted. It’s commonly assumed that increasing the number of cells will automatically enhance throughput. However, real-world scenarios often show that this approach can lead to diminishing returns and significant cost implications.
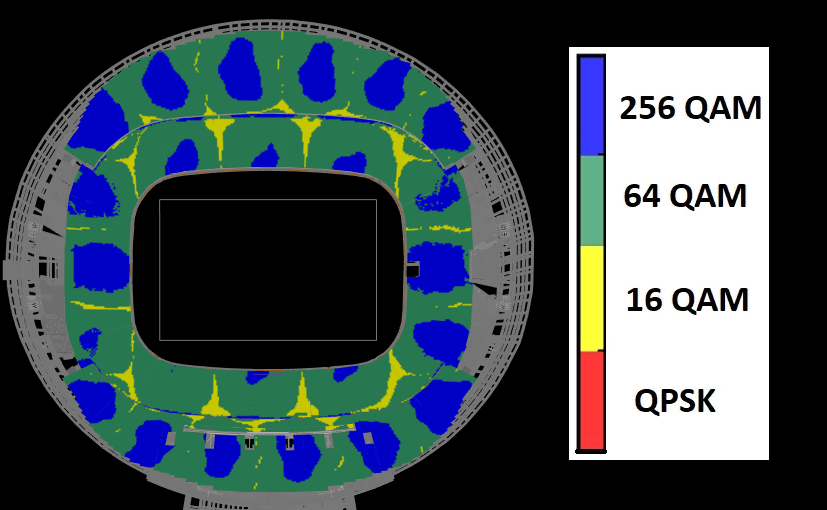
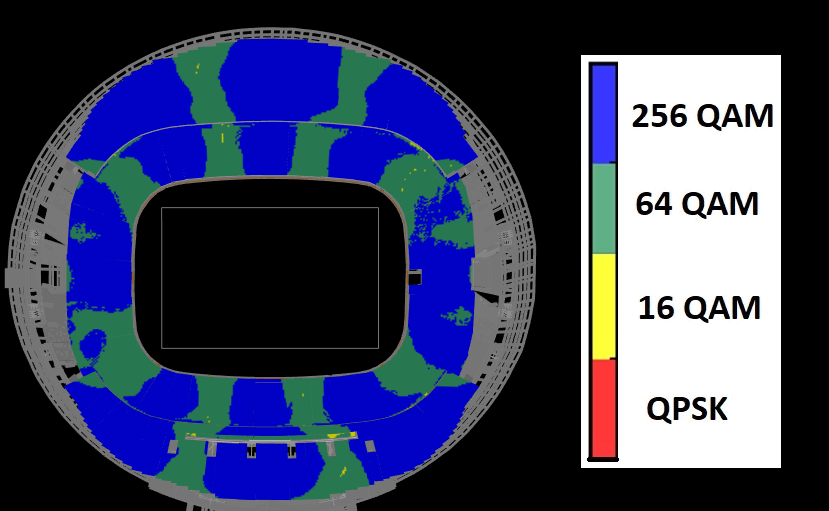
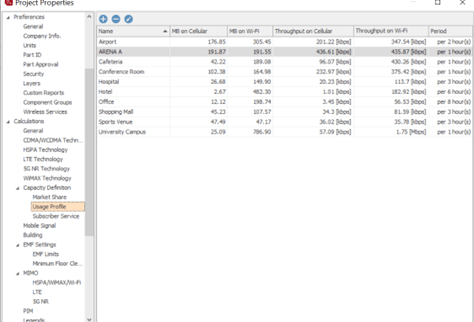
For example, transitioning from an 18-cell to a 24-cell design might not yield the expected increase in throughput. An 18-cell configuration could deliver 400 kilobits per second (one layer of LTE 20 MHz taken here as a reference for comparison), while the 24-cell design might exhibit performance degradation. This unexpected (from the first look) outcome emphasizes the importance of finding the optimal balance in cell deployment.
iBwave can help visualize that the total capacity of the radio interface is saturated and maximum for the specific range of deployed cells (PCIs). This optimum range can be assessed through modeling and predictions. For example, below, the RF capacity achieved with 18 cells is equal to the case of 24 cells under the same antenna type and traffic demand (LTE-A 1800, 20 MHz considered).
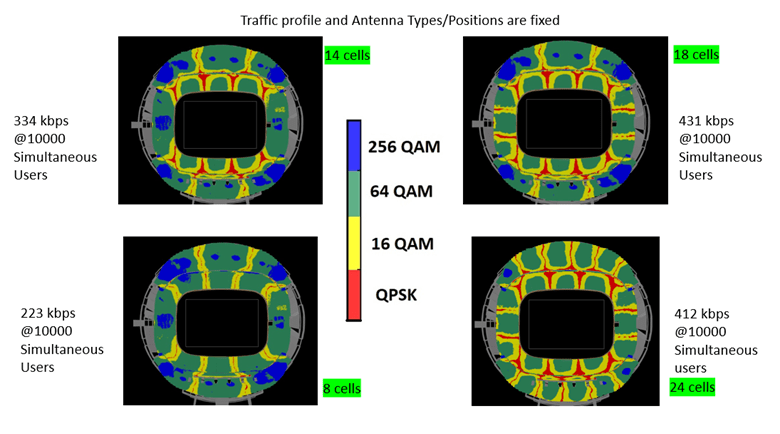
Planners need to identify the point where the network achieves maximum efficiency without unnecessary hardware investment and increased licensing costs.
This insight underscores the need for careful planning and simulation using tools like iBwave to predict how different cell configurations will perform under varying traffic conditions. By doing so, network designers can ensure that their deployments are both effective and cost-efficient, aligning with the specific needs and constraints of stadium environments. Focused work in iBwave with antenna positions and patterns can help minimize the degradation of 256 QAM footprints (under load) in case of a higher number of cells deployed.
The Practical Curve and Real-World Applications
In stadium network design, the practical curve derived from simulations using tools like iBwave plays a crucial role in optimizing performance. This curve illustrates the relationship between the number of cells deployed and network throughput. It serves as a guide to determine the optimal cell configuration that balances coverage and capacity without overinvesting in infrastructure.
For example, when considering a deployment of 24 cells, it’s essential to evaluate whether this exceeds the optimal point. Over-deployment can lead to challenges such as limited Signal-to-Noise Ratio (SNR), which may compromise network performance rather than enhance it. This highlights the importance of leveraging simulation tools to forecast how different cell configurations will perform under actual usage conditions.
Over-dimensioning for the Stadiums can limit achievable CQI/SNIR values, and corresponding capacity loss cannot be further compensated with SW features as general spectrum efficiency would appear to be limited
iBwave includes capacity-related calculations as part of RF planning, which allows control of the effect of PDSCH SNIR degradation. Indeed, it shall be properly taken into account for particular Propagation scenarios of the Stadium and its Architecture.
Real-world validation of the practical curve involves comparing various network designs across different stadiums. By doing so, network planners can ensure that their chosen deployment strategy not only meets performance expectations but also aligns with budgetary and operational constraints. This approach underscores the necessity of making informed decisions based on empirical data rather than theoretical assumptions.
Traffic Models and User Distribution
In stadiums, the traffic profile is typically heavy, with users transmitting substantial amounts of data. By setting up a comprehensive traffic model in advanced network planning tools such as iBwave, network planners can simulate various scenarios, such as file downloads, phone calls, and emails, to understand how the network will perform under peak conditions.
The effect of people’s relocations between upper and lower tribunes of the Stadium:
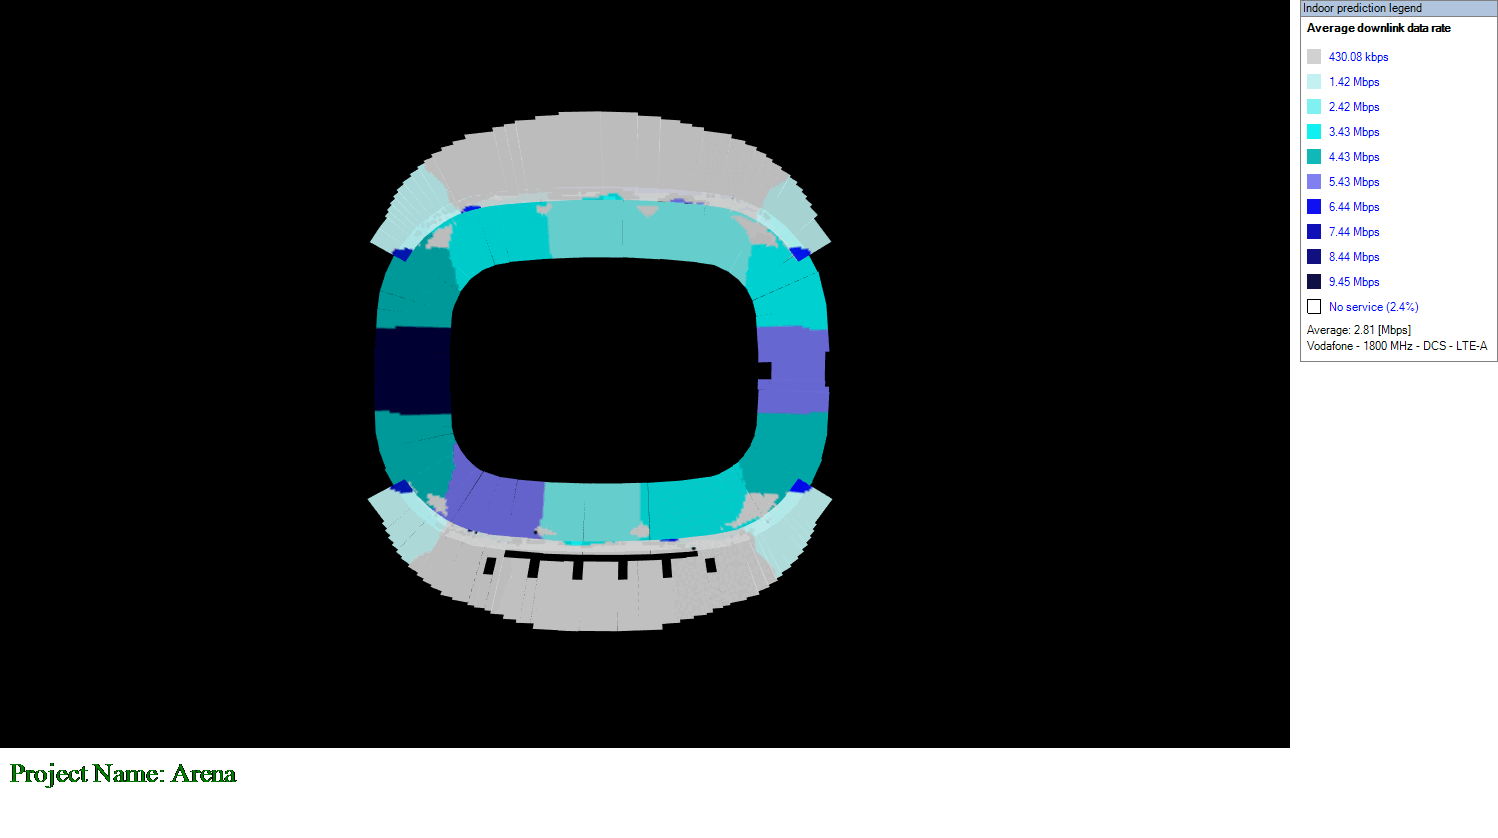
Interestingly, the user distribution within the stadium significantly affects network performance. Areas with fewer users, such as corners, often show higher average throughput due to less congestion. Additionally, dynamic scenarios, like users moving from upper to lower tribunes at the end of a game, can be modeled to predict changes in network performance.
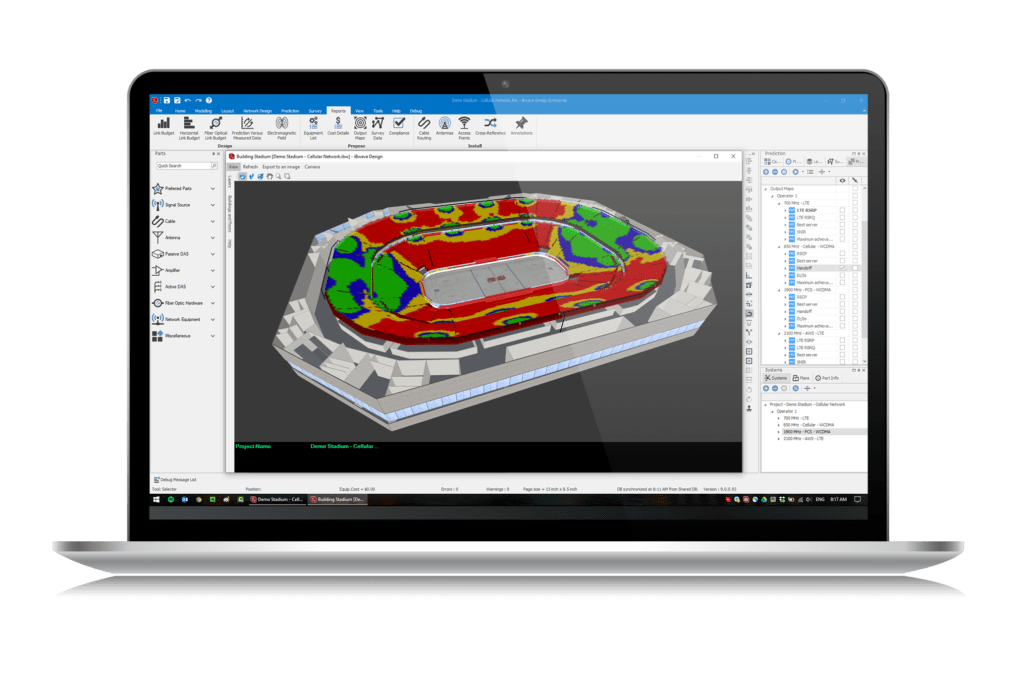
Case Study: Hockey Arena
Hockey arenas present unique challenges due to their dense architecture and reflective surfaces. In such environments, planning requires innovative approaches, like using narrow antennas to create synthetic footprints that balance the load across different tribunes. This strategy ensures that both upper and lower tribunes receive adequate coverage and that SNR is maintained at optimal levels.
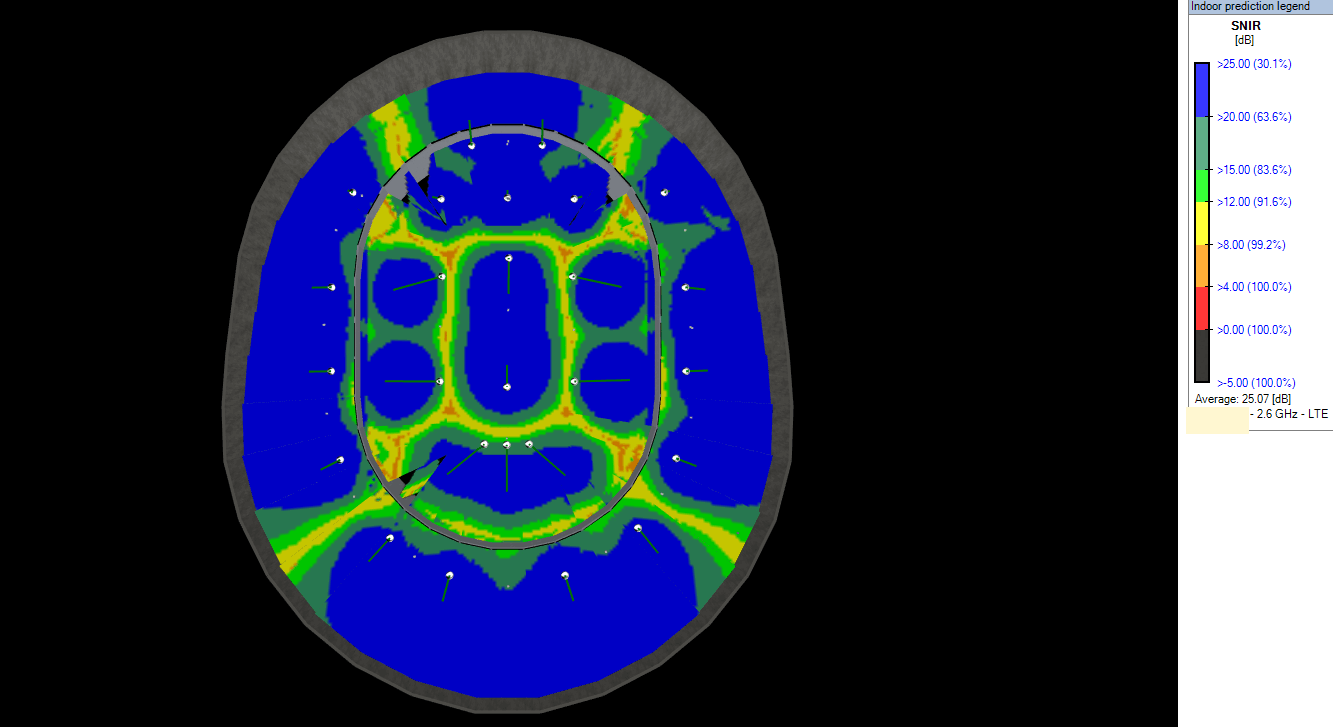
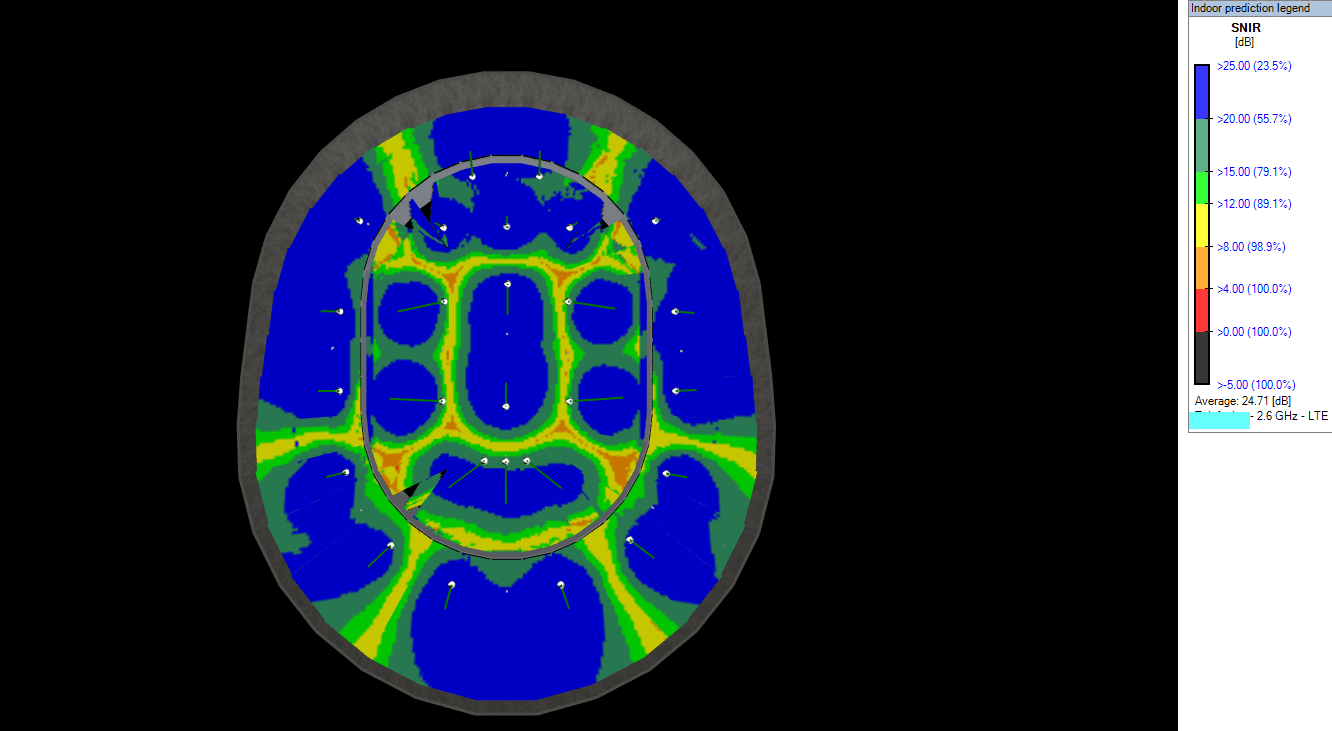
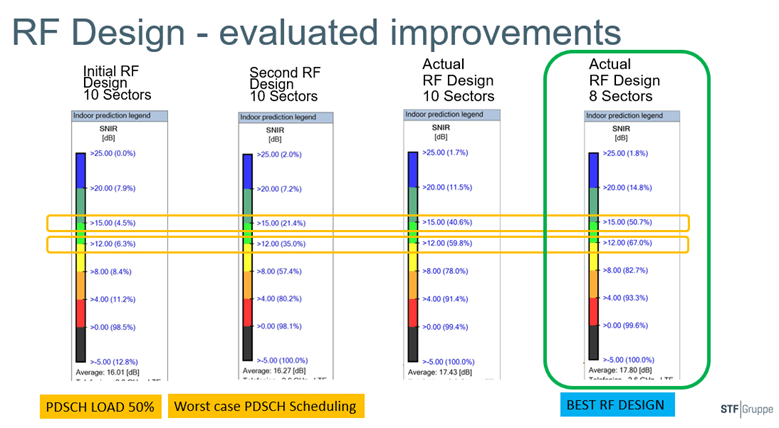
Two designs for a hockey arena, one with eight cells and another with ten cells, illustrate the importance of architecture in determining the optimal number of cells. Despite the potential for higher capacity with more cells, the design with eight cells might be preferable due to better overall SNR and reduced degradation areas.
In the animations below, we show and compare under dynamically changing PDSCH load (load of data channel) 2 RF design versions for the Hockey Arena. PDSCH channel being taken in worst case manner —> users of neighboring sectors get the same time-frequency resource, so we consider the worst case which is acceptable for the comparison. Even in a situation when XLS calculation shows the need for 10 sectors, the attempted 10 sectors design is losing on the quality of SNR distribution.
8 Sectors:
10 Sectors:
Load changed from 5-50%
SNR vs PDSCH Load 5-50%
Case Study: Football Stadium
Football stadiums present unique challenges for designing cellular networks due to variable user densities and fluctuating traffic patterns. Optimizing antenna placements and network configurations is crucial to ensure consistent coverage and throughput across different sections of the stadium.
User distribution within football stadiums significantly impacts network performance. Areas with higher concentrations of spectators, such as seating sections near entrances or concessions, often experience higher network demand. Precise traffic modeling is essential to predict and manage these variations effectively.
Advanced simulation tools enable planners to simulate peak event scenarios and optimize network configurations accordingly. By modeling different usage scenarios, planners can fine-tune antenna placements and adjust network parameters to meet the demands of large crowds during games and events.
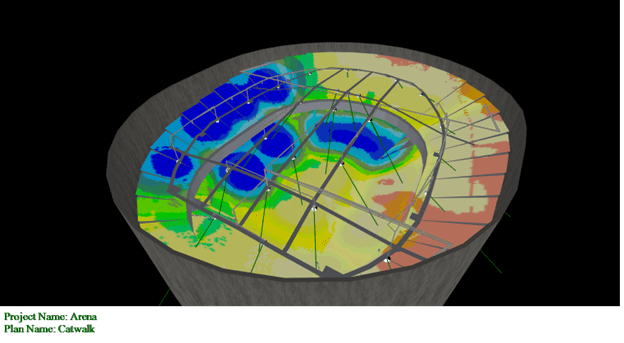
EMF Calculation and Safety Considerations
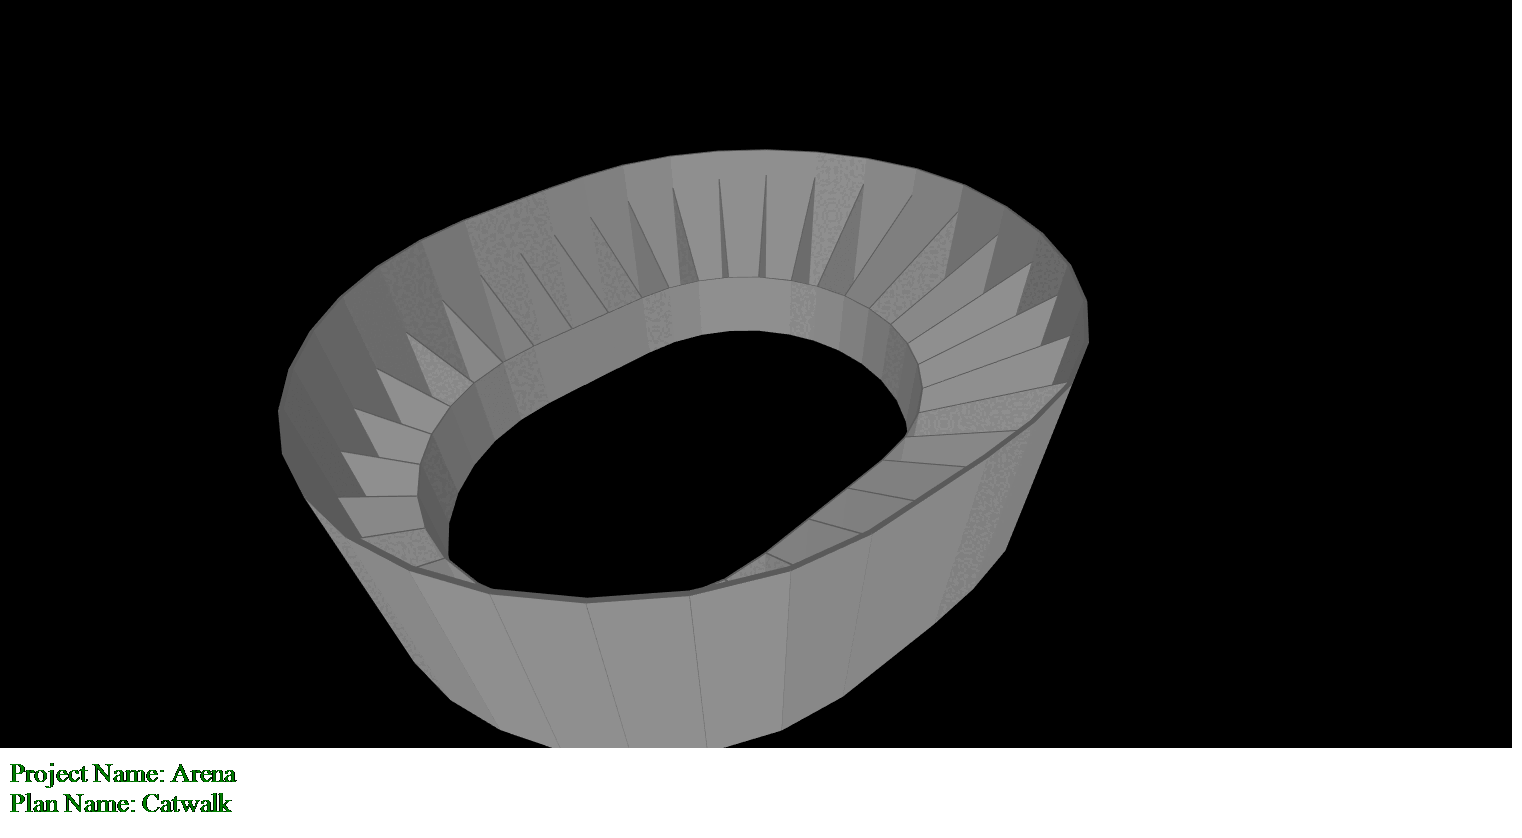
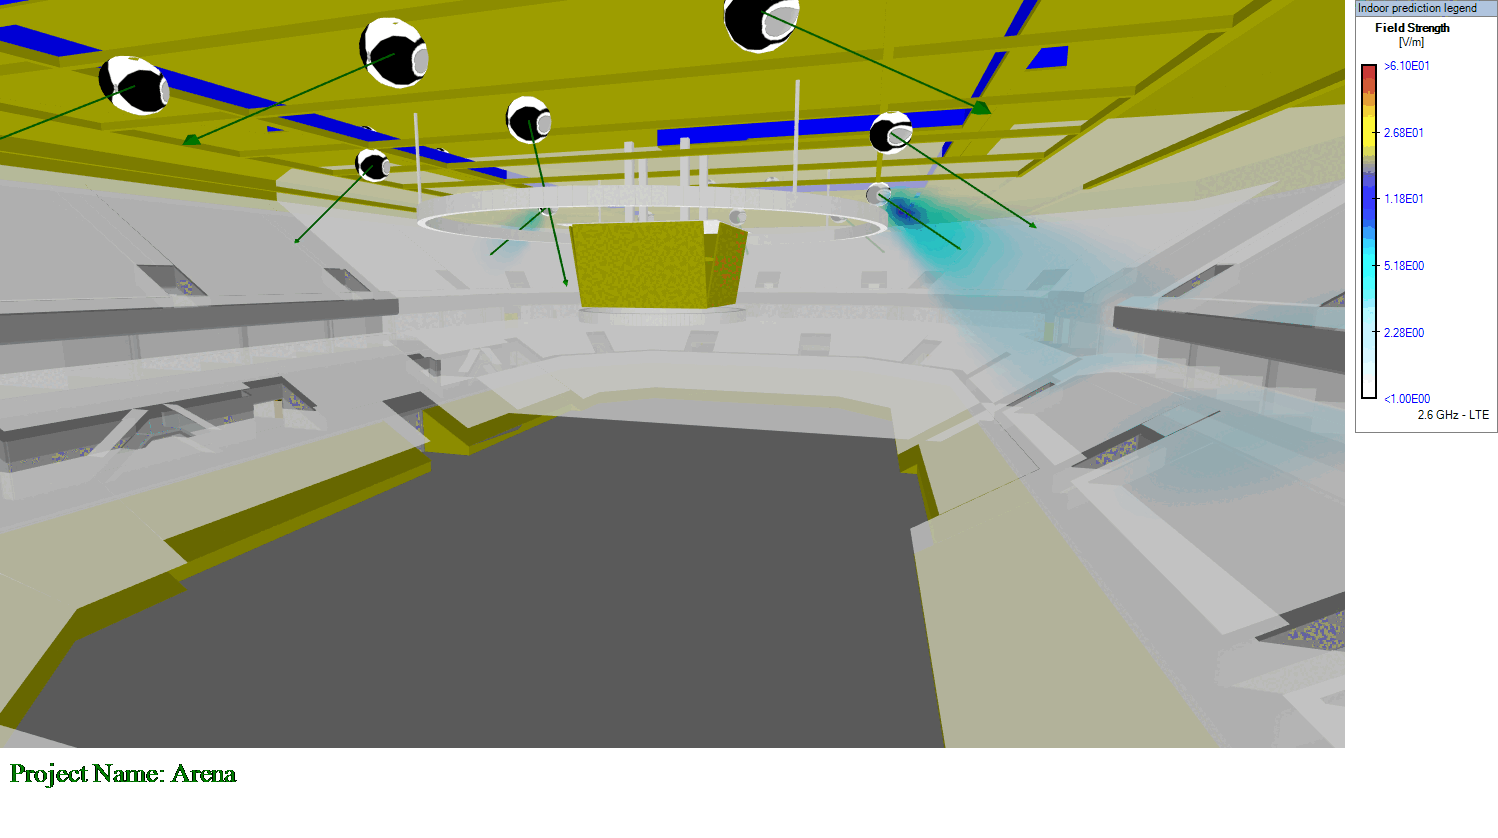
Ensuring spectator safety is paramount, and this includes calculating Electromagnetic Field (EMF) exposure. By modeling the stadium in detail, network planners can identify areas with potentially high RF energy density, ensuring compliance with safety regulations. This analysis is crucial for maintaining a safe environment, especially in areas like catwalks where maintenance personnel might be exposed to higher RF levels.
Bridging Indoor and Outdoor Stadium Coverage
Effective stadium network design also involves bridging the gap between indoor and outdoor coverage. Using tools like iBwave Reach, planners can import digital terrain data and simulate the penetration of outdoor signals into the stadium. This helps in identifying interference and ensuring seamless coverage transitions between indoor and outdoor environments.
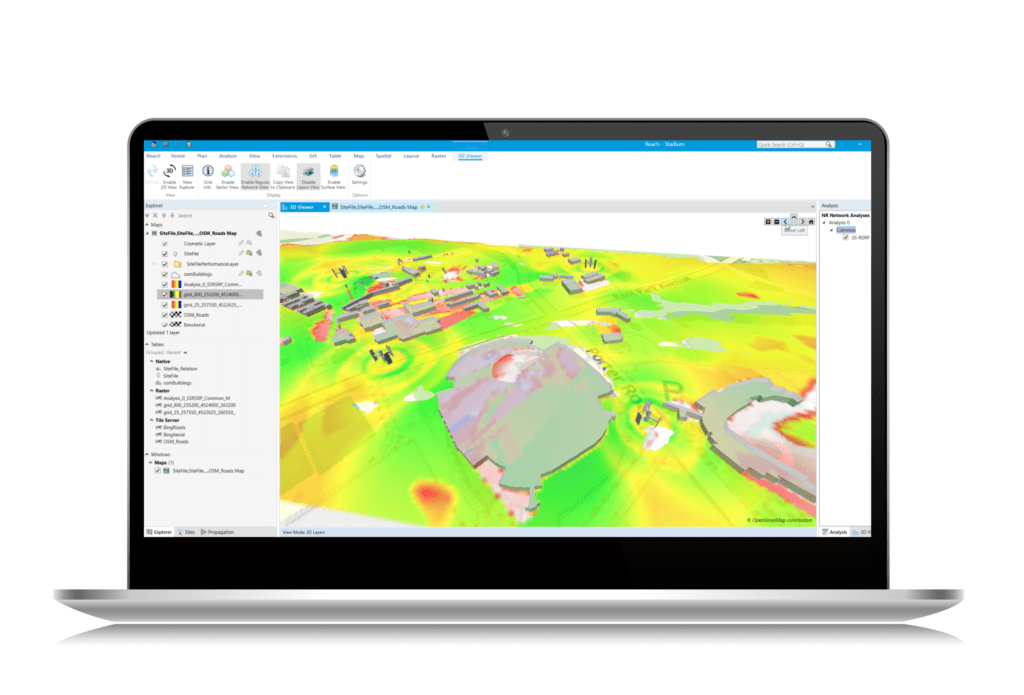
Enhancing Stadium Network Design with iBwave
iBwave is instrumental in optimizing stadium network designs by providing advanced simulation capabilities. Network planners leverage iBwave Design to accurately predict network performance under various scenarios, including peak traffic conditions and dynamic user distributions. By simulating signal propagation and analyzing coverage gaps, iBwave ensures that stadium networks are robust and reliable, meeting the stringent demands of modern venues.
Moreover, iBwave’s predictive accuracy allows planners to fine-tune antenna placements and adjust network configurations proactively. This capability not only enhances network efficiency but also helps in optimizing investments by aligning infrastructure deployment with actual usage patterns. As stadiums continue to evolve in complexity and connectivity requirements, iBwave remains a pivotal tool for achieving superior network performance and user satisfaction.
Conclusion
In conclusion, optimizing a cellular network for a stadium involves a delicate balance between increasing throughput, managing costs, and ensuring user satisfaction. By leveraging advanced modeling tools and understanding the practical curve, network planners can design efficient and effective networks that meet the demands of high-traffic events. Whether it’s a football stadium or a hockey arena, the principles of careful planning, dynamic modeling, and continuous optimization remain vital to delivering a superior user experience.
To learn more about stadium network design, please watch our on-demand webinar with Ralf Burkard and our special guest, Victor Pyachev, from STF Gruppe!
Check out our blog for more tips and topics about wireless networks and their planning!
Ralf has more than 28 years of experience in telecommunications and more than 14 years of experience in a people management role.
Ralf graduated with a diploma in Telecommunications on “Indoor wireless Coverage solutions” in Germany in 1995 and started his wireless career as Radio Design Engineer at Motorola in Hungary and Austria.
Working for System suppliers and network operators in various countries, he developed strong intercultural communication and relationship skills, functional & technical know-how and essential business skills.
In his different roles for global network operators he gained expertise as Network Design Engineer at VIAG Interkom (now Telefonica) in Germany in year 1997, followed by RF Planning & Network Optimization Manager at tele.ring (now t-mobile) in Austria in year 2000, followed by Head of Radio Network Planning & Optimisation at Hutchison 3G Austria in year 2001.
In 2006, Ralf joint Shyam Telecom GmbH in Germany in his role as Chief Technical Officer, responsible for the European business of the Indian based network equipment supplier ShyamTelecom for radio signal enhancement and IP backhaul solutions.
During his career, Ralf continuously participated at conferences and tradeshows as a delegate and speaker.
Ralf joined iBwave in year 2015, responsible for Sales Engineering for Central & Eastern Europe, UK and Nordics. He is also an iBwave certified instructor for In-Class training courses.
- The Most Effective Strategies for Predicting Network Coverage in Future Constructions – May 10, 2024
- Enhancing Logistics and Transportation Management with Private 5G Networks – November 16, 2023
- Improving Energy and Utilities Operations and Management with Private 5G Utilities and Energy Wireless Networks – October 23, 2023
Victor Pyachev is a Wireless Engineer specializing in RAN development for Mobile Network Operators. With eight years at Qualcomm GmbH, he excelled in System Engineering for WCDMA, LTE-A, and early 5G NR projects. Currently with STF Gruppe GmbH, Victor focuses on 5G/LTE Private and Campus Networks, overcoming deployment challenges and specializing in private 5G RF Design for large industrial campuses. He also has experience in RAN Optimization and Network performance assessments. His research interests include realistic 5G NR capacity predictions, specialized radio network dimensioning, and Phased Array Antenna Systems for advancing wireless technology.
Ralf has more than 28 years of experience in telecommunications and more than 14 years of experience in a people management role.
Ralf graduated with a diploma in Telecommunications on “Indoor wireless Coverage solutions” in Germany in 1995 and started his wireless career as Radio Design Engineer at Motorola in Hungary and Austria.
Working for System suppliers and network operators in various countries, he developed strong intercultural communication and relationship skills, functional & technical know-how and essential business skills.
In his different roles for global network operators he gained expertise as Network Design Engineer at VIAG Interkom (now Telefonica) in Germany in year 1997, followed by RF Planning & Network Optimization Manager at tele.ring (now t-mobile) in Austria in year 2000, followed by Head of Radio Network Planning & Optimisation at Hutchison 3G Austria in year 2001.
In 2006, Ralf joint Shyam Telecom GmbH in Germany in his role as Chief Technical Officer, responsible for the European business of the Indian based network equipment supplier ShyamTelecom for radio signal enhancement and IP backhaul solutions.
During his career, Ralf continuously participated at conferences and tradeshows as a delegate and speaker.
Ralf joined iBwave in year 2015, responsible for Sales Engineering for Central & Eastern Europe, UK and Nordics. He is also an iBwave certified instructor for In-Class training courses.


