
Analysis of CW Measurements @ 28 GHz Taken by Consultix
Share

Earlier this year, Consultix, a leading vendor of portable CW test equipment, collected CW survey data at 28 GHz in an office environment, and shared the data with iBwave. We have post processed the data and used it as benchmark to compare with our default propagation model at 28 GHz, and also to calibrate the model. This blog entry summarizes our findings.
Equipment used: CW transmitter and receiver
Frequency: 28 GHz
Transmit antenna: SISO, omnidirectional.
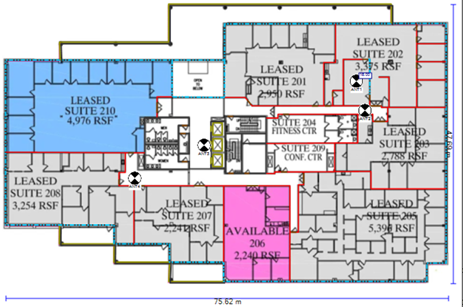
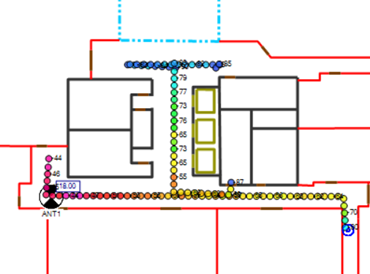
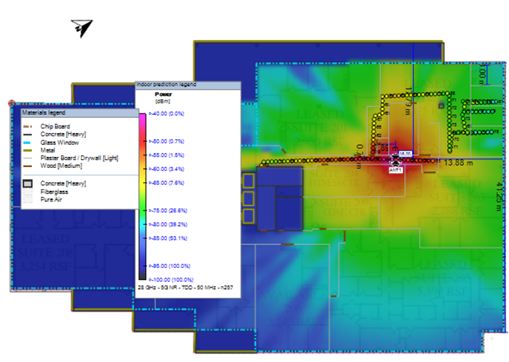
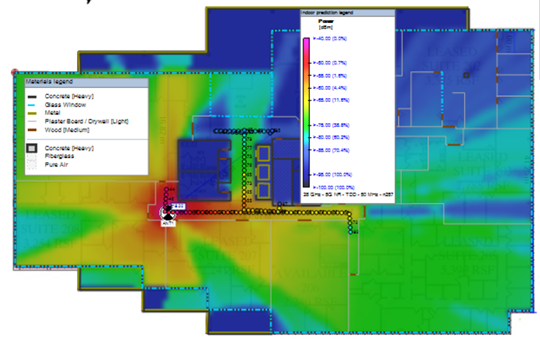
The modelling of the office space and its inner walls was done by Consultix. The layout of the office space with 4 antenna locations is shown below:
Post processing was done in two steps.
- We removed fast fading by averaging the receive data every 0.2 meters, which is 20 wavelengths at 28 GHz.
- We eliminated the data that was too far away from antenna.
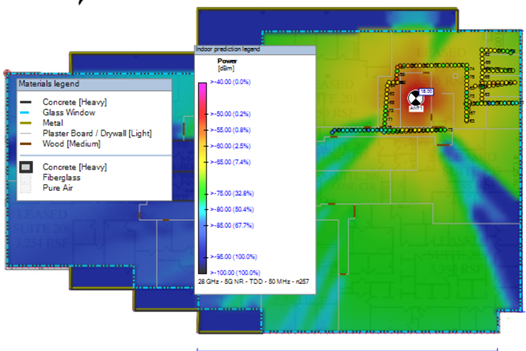
This is the post processed CW survey data:
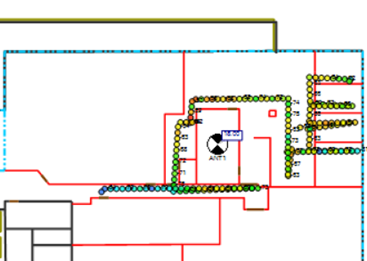
ANTENNA 1
ANTENNA 2
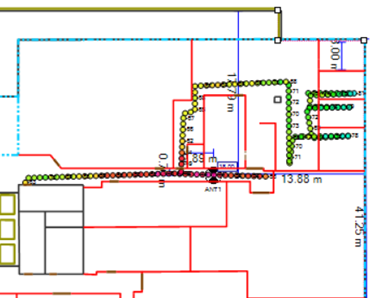
ANTENNA 3
ANTENNA 4
When we inspected the survey data in more details, we noticed the following:
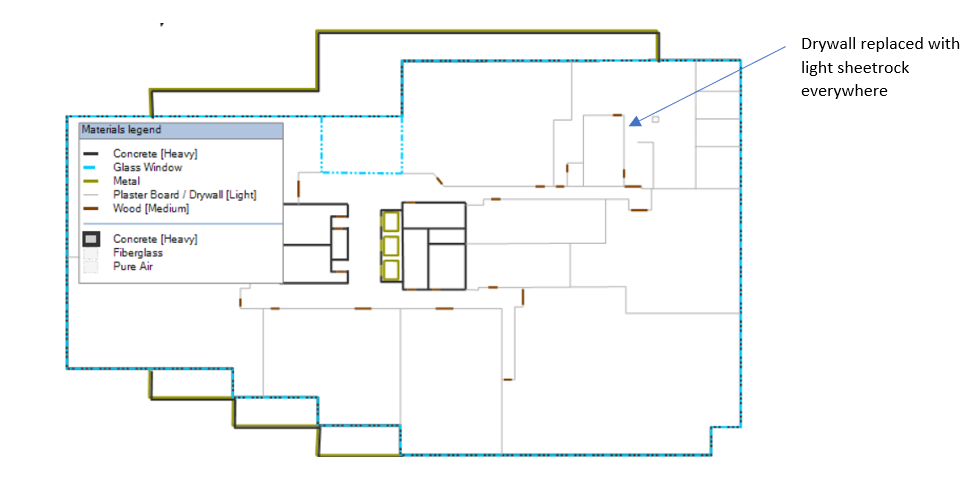
- The predicted Non-Line of Sight signal behind all inner walls that were modelled as drywall was much lower than CW survey data. When comparing similar materials, we noticed that drywall has much higher penetration loss than sheetrock. Drywall penetration loss at 28 GHz was taken from ITU-R recommendation, while sheetrock penetration loss at the same frequency was extrapolated from measurements below 2 GHz. We decided to replace drywall with plaster sheetrock light everywhere in the floorplan, to improve prediction accuracy.
Office floor layout with modeled inner walls is shown below:
The next step was to investigate whether changing propagation constants g1 – g3 would help increase the default prediction accuracy. We found out that the optimum propagation accuracy is achieved by changing g2 and g3 propagation constant from the default value of 2.4 to 2.2. Those two propagation constants are used to calculate reflected and Non-LOS signal.
After we made the changes outlined above, we ran what we call the “default” predictions for each antenna. After that, we used CW survey data to optimize propagation constants and wall material penetration and reflection loss near each antenna, and then used the new values to run the “calibrated” predictions. Then we compared the statistic for uncalibrated and calibrated propagation prediction side by side. The results are shown below:
ANTENNA 1
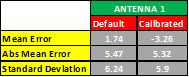
The absolute mean error and the standard deviation have only marginally improved after the calibration. This is because there is no Line of Sight data for Antenna 1. To improve the calibrated model, we need a mix of LOS and NLOS data.
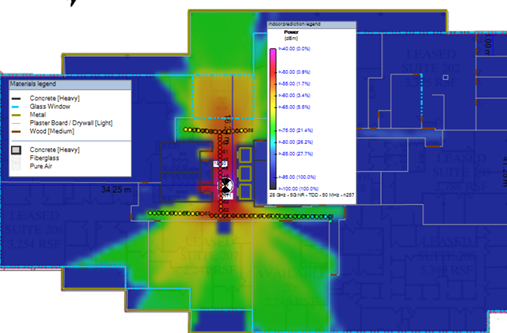
ANTENNA 2
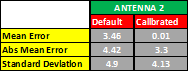
In this case the accuracy has improved a bit when calibrated model was used, compared with the default model. The default prediction itself is more accurate compared with the default prediction for Antenna 1. This is because we have a good mix of LOS and NLOS survey data for Antenna 2.
ANTENNA 3
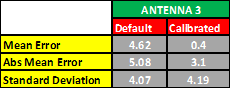
As was the case with Antenna 2, the calibrated propagation prediction is significantly more accurate than the default prediction. As was the case with Antenna 2, there is plenty of LOS survey data to go with the NLOS data.
ANTENNA 4
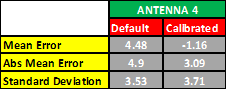
As was the case with Antenna 2 and 3, the prediction using the calibrated model is significantly more accurate. As was the case with Antenna 2 and 3, we had a good mix of LOS and NLOS survey data as well.
GENERAL REMARKS:
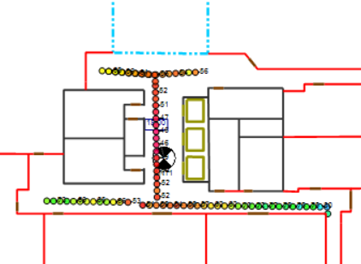
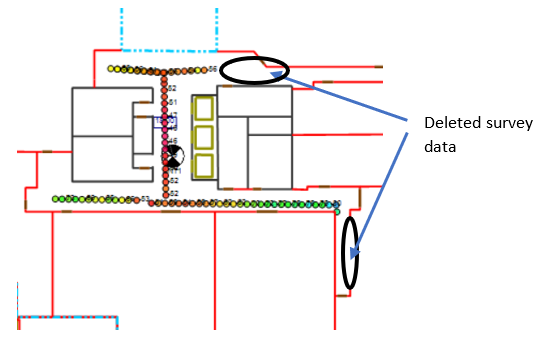
- When we were deciding which survey data to keep and which to delete, we made the decision based on how far away the data was from antenna, and whether it was in Non-LOS. For example, for Antenna 4 we had a couple of areas that were in NLOS and far away which we deleted, as shown in the figure below:
- The mean and absolute mean error values for default prediction are similar for Antenna 3. This is also the case for Antenna 4. Because the mean error is positive and the delta between the mean and absolute mean error is small, we conclude that the survey data is almost always higher than the predicted data. This means that iBwave prediction for antenna 3 and 4 is consistently more pessimistic than the measured data. This is not necessarily the case for default prediction for Antenna 1 and 2, because the delta between mean error and the absolute error is significant.
- In retrospect, the default prediction absolute error is in the 4.5-5.5 dB range. The default prediction standard deviation is in the 3.5 – 6.2 dB range. This is consistent with prediction accuracy at lower frequencies. While it is true that we had to fine tune the floorplan material modeling (by replacing the high penetration loss material with lower penetration loss material), what we learned from this measurement campaign is that inner walls should be modeled as light plaster sheetrock, not as drywall.
- Finally, we learned that 28 GHz signal propagates through typical office walls/barriers better than expected. We had to adjust propagation constants y2 and y3 to reflect that.
ABOUT CONSULTIX:
Consultix is a leading vendor of portable RF test equipment. The company is remarkably known for its comprehensive portfolio of RF analyzers, CW equipment and monitoring solutions serving the Small cells and DAS market worldwide.
Vladan Jevremovic has joined iBwave in 2009 as Director of Engineering Solutions and has been in the Telecommunication industry for more than 17 years. He is responsible for developing custom solutions as a part of professional services portfolio. He’s also responsible for ideation and requirements specification in the new product development life cycle, and works closely with the development team on new product implementation. Vladan received his Diploma Ing. from University of Belgrade in Serbia, and his Masters and PhD from University of Colorado at Boulder.
- A Deep Dive into iBwave Design Prediction Accuracy Report - November 18, 2024
- At a Glance: What Is New in Wi-Fi 7? - July 4, 2024
- Accurate Prediction Simplifies Private, In-Building 5G Network Deployments - March 1, 2023


I’ve always thought sheetrock was a brand of drywall and essentially are pretty much interchangeable. Can you help clarify what the difference is as far as iBwave is concerned and how would one know which is which by looking at a painted wall?
You are correct, Sheetrock is a brand of Drywall and that is why we recently renamed all Sheetrock to Drywall in our tool. In our data base, we have different Drywall types and they have different electrical properties (mainly permittivity). The transmission and reflection losses are calculated based on the electrical properties (permittivity) of the materials. One of these Drywall has much higher transmission losses at mmwave bands than the others. In their initial modeling, they used the Deprecated Drywall type with high transmission losses which does not match the measured values. So, we changed it to LIGHT Drywall with… Read more »
What was he EIRPs from each antenna?
It was 18 dBmi. The amplifier power was 13 dBi, and antenna gain was 5 dBI
I thought that Sheetrock was just a brand of drywall….they are essentially the same thing.
Why did you average with 20 wavelengths? Per Lee’s criteria, we usually go with 40 wavelengths.
In his paper, Lee showed averaging over 5, 10, 20 and 40 wavelengths, and how changing the averaging length affects the standard deviation of the estimated mean value. The greater the averaging wavelength, the smaller the standard deviation of the estimated mean value. In our tool we have options for 5, 10 and 20 wavelengths. The reason we included 5 and 10 wavelengths, despite a larger standard deviation, is to able to average out field data taken at low frequencies (150 MHz, 400 MHz), and still have enough data points after averaging to have meaningful input for calibration. Keep in… Read more »
Vladan, how do i find this material in the database, “Plaster board / drywall (light)” is the same that “light plaster sheetrock” in database?
Hello Pedro,
You can find this material under subcategory “Plaster”. There, you have 4 options: Drywall (deprecated), Plaster Board/Drywall (heavy), Plaster Board/Drywall (Light) and Plaster Board/Drywall (Optimized at 1800 MHz). Choose the third one.