
Exploring Attenuation Across Materials & the 2.4GHZ / 5GHZ Bands
Share

A Twitter post popped up in my news feed last week showing a graph of the attenuation values for different types of glass – mainly the distinction between a regular glass window and a low emissions (Low E) window. It was showing that Low E windows have a much higher attenuation value than regular windows—a fact that could impact prediction of a network significantly if the incorrect type of window is selected during modeling.
Turns out, it’s not so uncommon when looking across the different types of materials in ‘material families’ like glass, concrete, plaster, and wood – especially the heavier varieties. While looking into these different materials, I also started to see a trend amongst the ‘heavier’ types of materials like concrete—that attenuation values can even be different within the same material when comparing signal loss for 2.4GHz vs. 5GHz bands.
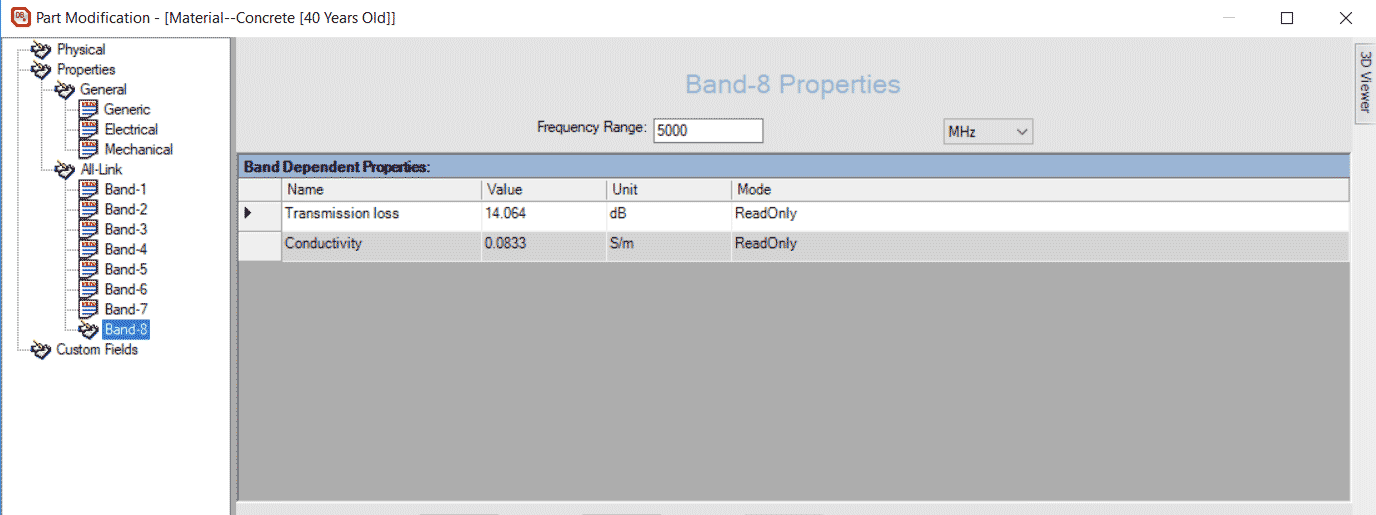
2.4GHz Transmission Loss Value for 40 Yr Old Concrete ?
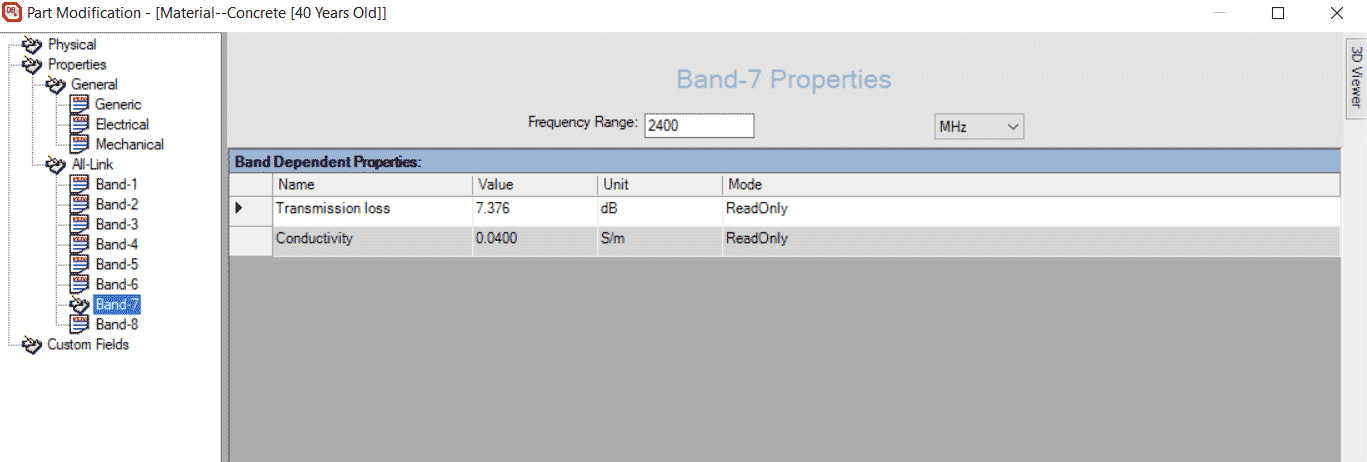
5GHz Transmission Loss Value for 40 Yr Old Concrete ?
For many WLAN designs, this may not be such an issue because attenuation is often measured on-site using an AP on a stick – but what about for Greenfield buildings? Or when just providing a quote? Or doing a strictly predictive design? In these cases, there may be no walls to get the on-site readings or going on-site may just not be a possibility at that point in the project.
In this blog I look at two things:
- The difference in attenuation across the 2.4GHZ and 5GHZ bands for the same material, and the potential impact on prediction accuracy
- The difference in attenuation values for materials in the same family, and the effect of selecting the wrong material when modeling.
Attenuation: Differences Between 2.4GHz & 5GHz Bands
As mentioned above, as I was looking at attenuation values through different types of materials I realized that there are quite a few ‘heavy’ materials that have significantly different attenuation values for the 2.4GHZ and 5GHz bands.
Some examples of significant and not so significant differences:
| 2.4GHz (dBm) | 5GHz (dBm) | |
| Concrete – Heavy | 22.792 | 44.769 |
| Lime Brick | 4.295 | 7.799 |
| Dry Wall Partition | 5.388 | 10.114 |
| Chip Board | 0.463 | 0.838 |
As it’s well known from theory and practice of radio propagation, as frequency increases, path loss increases. With materials, very similar thing happens – as frequency increases from 2.4GHz band to 5 GHz band, transmission loss will also increase. For example, using the concrete heavy example in the table above and imagine there is a concrete heavy wall between the AP and the client. At 2.4 GHz, the transmission loss is ~23 dB- meaning that as the signal goes through the wall it is decreasing by that amount of attenuation. Now if the operating frequency is changed to 5 GHz, the transmission loss is going to be higher because the frequency is higher – so in this case it goes to ~45 dB. This is most often the case with heavier materials, and although a difference can be seen in lighter materials, it would not have as much potential impact on prediction.
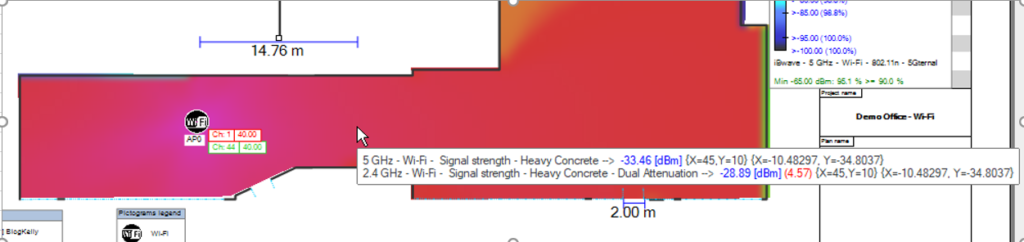
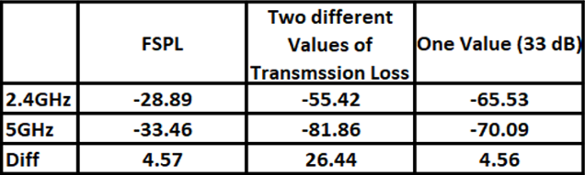
To illustrate this, I ran a prediction just showing the Free Space Path Loss for a single AP on 2.4GHz and 5GHz bands. In it the results show:
- 2.4GHz: -33.46
- 5GHz: -28.9
So with no obstruction, there is about a 4.57 dB difference in attenuation between the two bands.
What’s the Potential Impact?
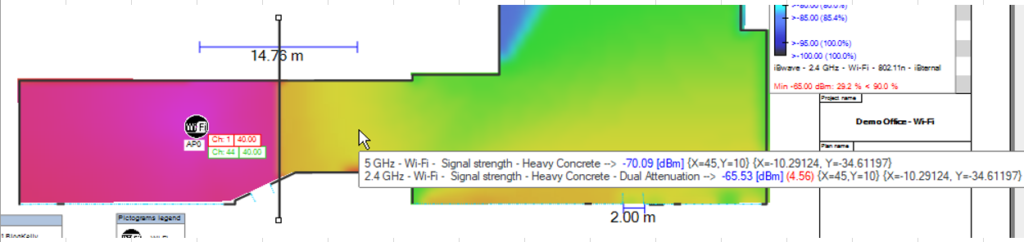
Next I wanted to look at what happens when there is an obstruction (in this case a concrete wall) and the potential impact on prediction results in this case.
Adding a ‘Concrete-Heavy’ wall with the following attenuation values, I re-ran the signal strength heatmaps.
- 2.4GHz : ~23 dBm
- 5GHz : ~44 dBm
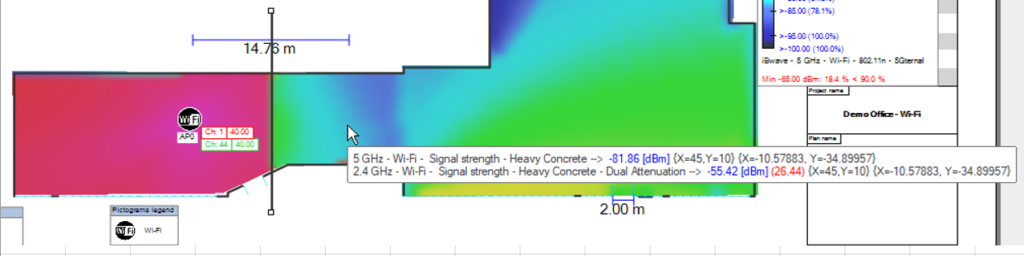
And got these results:
- 2.4GHz: -55.42 dBm
- 5GHz: – -81.86 dBm
To compare what would happen if I just used one attenuation value, I created a custom material by duplicating the ‘Concrete-Heavy” and assigning it just one attenuation value of ~33 dBM (the average of the values for 2.4GHz & 5GHz above).
The results for that were:
- 2.4GHz: –65.53 dBm
- 5GHz: –70.09 dBm
From results (summarized in the table belowe), it is seen that when we apply two values – one for 2.4Ghz and one for 5GHz bands (23 dB and 44 dB), the difference in prediction between the two bands is significant. This difference is as expected because the heavy materials would have more attenuations in high frequency bands. However, when we apply only one value (33 dB) for the material that represents both bands, it’s noticed that the difference between the two bands is not significant (which it should be).
Different Attenuation Values Across the Same Family of Materials
Next let’s look at the different attenuation values found within familes of the same materials.
Staying focused on materials commonly used when modeling a venue, a couple of ‘material families’ started to stand out to me when looking at the range of attenuation values across the different types: Glass, Concrete, and Wood.
Glass
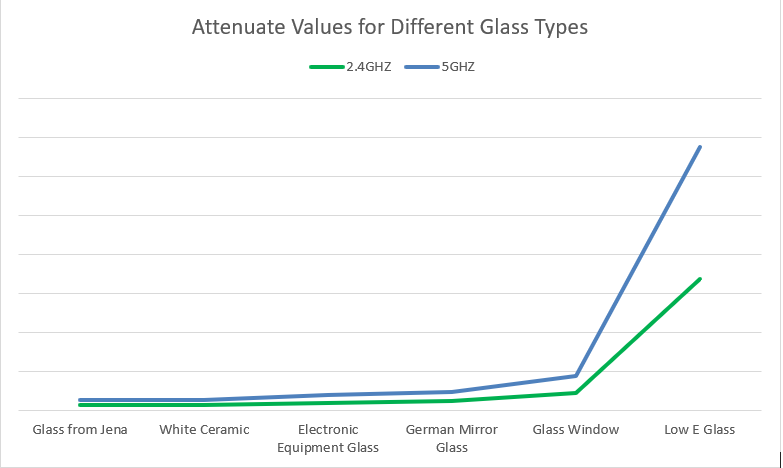
In the iBwave database of components, there are several different types of glass listed for used during modeling:
- Electronic Equipment Glass
- German Mirror Glass
- Glass from Jena
- Glass Window
- Low E Glass
- White Ceramic
Plotting their attenuation values from lowest to high, for both 2.4GHz and 5GHz bands, you get something that looks like this ?
Concrete
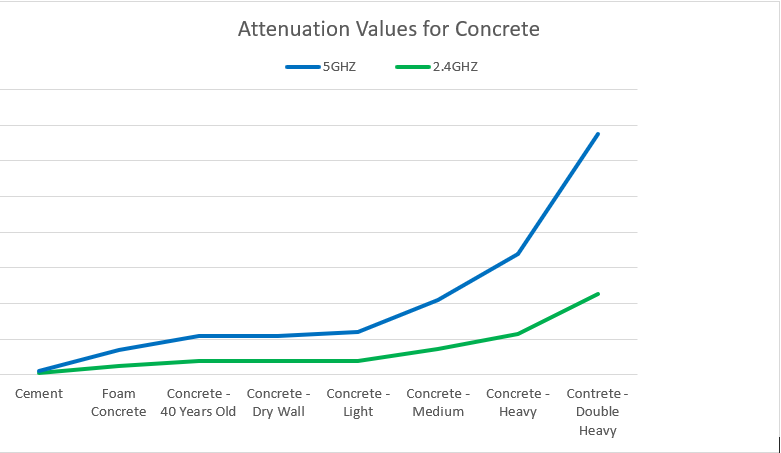
Perhaps one of the most common modeling materials is concrete – but when you start to look across the different types of concrete, including the age of the concrete, the attenuation values do not always look the same.
In our database, we list several types of concrete, here are a few that I looked at:
- Cement
- Concrete – 40 Years Old
- Concrete – Double Heavy
- Concrete – Dry without Steel
- Concrete – Dry Wall
- Concrete – Heavy
- Concrete – Medium
- Concrete – Light
- Concrete – White Wall
- Foam Concrete
That’s a lot of concretes to choose from when modeling – and when you look the range of attenuation values across them all, you can start to see why it would be important to model with the right concrete. ?
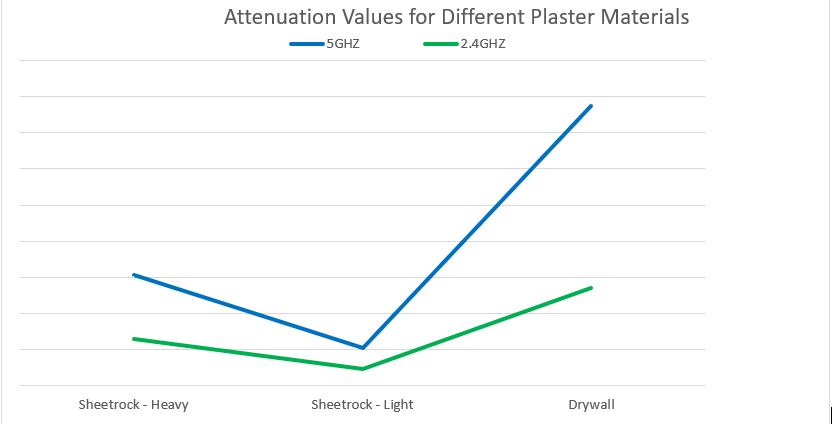
Plaster
In the database of materials, here are the different types of plaster you can choose when modeling the venue.
- Drywall
- Sheetrock (Heavy)
- Sheetrock (Light)
- Plaster Board / Ceiling Tile
And here’s what the different attenuation values look like compared to one another.
The Impact on Prediction
With that information, I started to wonder what the impact on prediction accuracy could be if a designer selected, say regular glass for a window when really it should be a low emissions glass often used now for newer buildings. Or what would happen if the venue was modeled with regular Concrete vs. older concrete for an older building – same with wood, what happens if the chipboard is used instead of particle board?
Let’s look at each of those scenarios and see what the potential impact on prediction accuracy could be.
Glass vs. Low E Glass
Using the floor of a regular, small, office space, I first ran prediction using the regular Glass for the windows and then replaced it with Low E glass to see what impact it would have on prediction were the wrong type of glass selected during modeling.
Results
| Glass Window (dBm) | Low E Glass (dBm) | Delta (dB) | |
| 2.4GHz | -38.50 | -67.91 | 29.41 |
| 5GHz | -43.49 | -72.85 | 29.36 |
Visual of the Different Signal Strength Heatmap Results
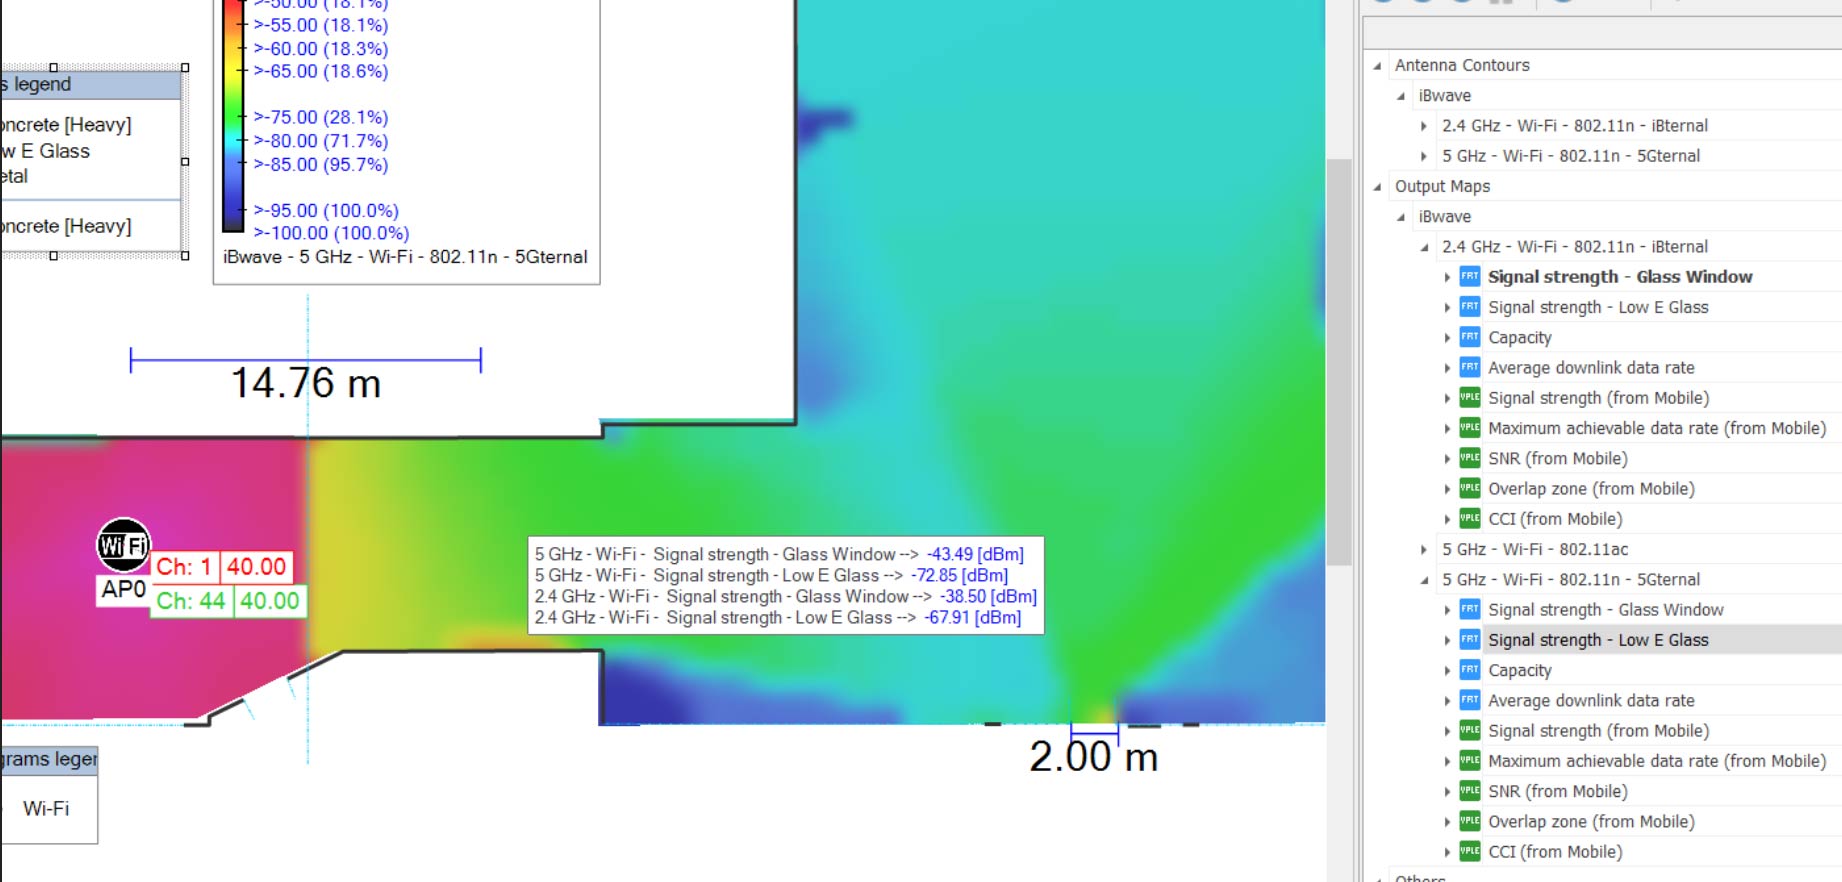
You can see that in this case, using regular windows to model and design with when the windows are Low E windows, could be a very costly mistake – in both network performance, and the cost to troubleshoot it post-installation.
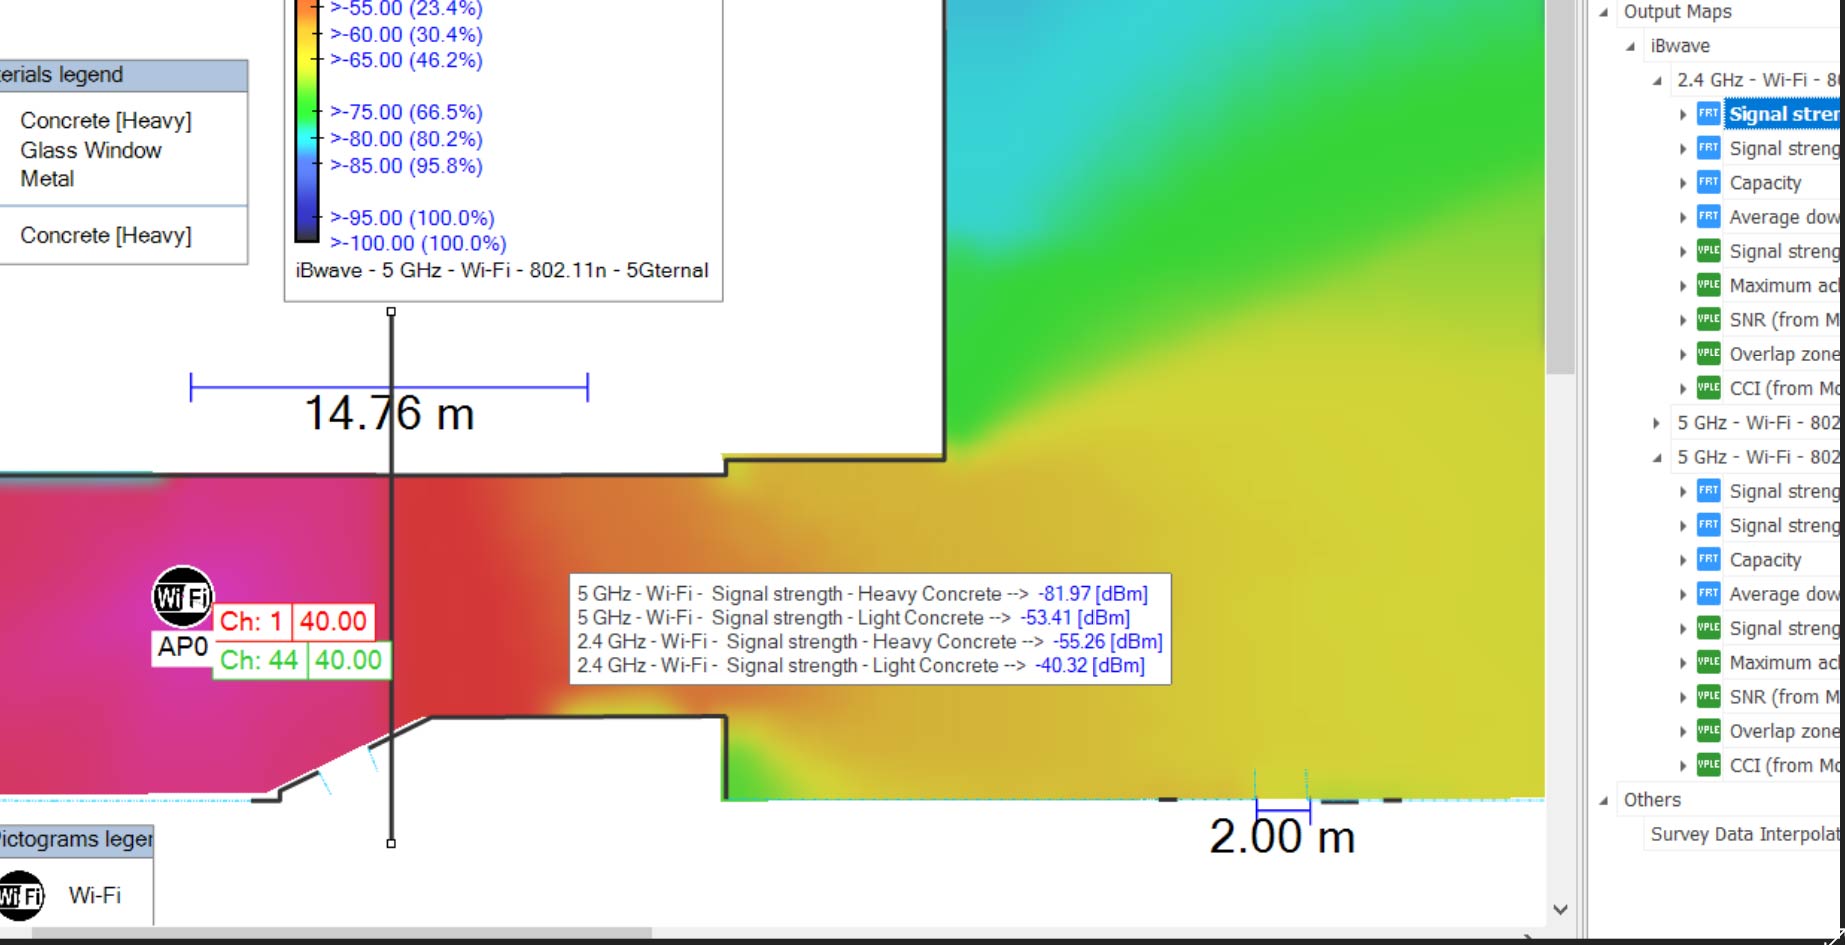
Heavy Concrete vs. Light Concrete
Next, I ran the same test, this time using two types of concretes, this time less extreme in attenuation differences: heavy concrete vs. light concrete.
| Light Concrete (dBm) | Heavy Concrete (dBm) | Delta (dB) | |
| 2.4GHz | -40.32 | -55.26 | 14.94 |
| 5GHz | -53.41 | -81.97 | 28.56 |
Visual of the Different Signal Strength Heatmap Results
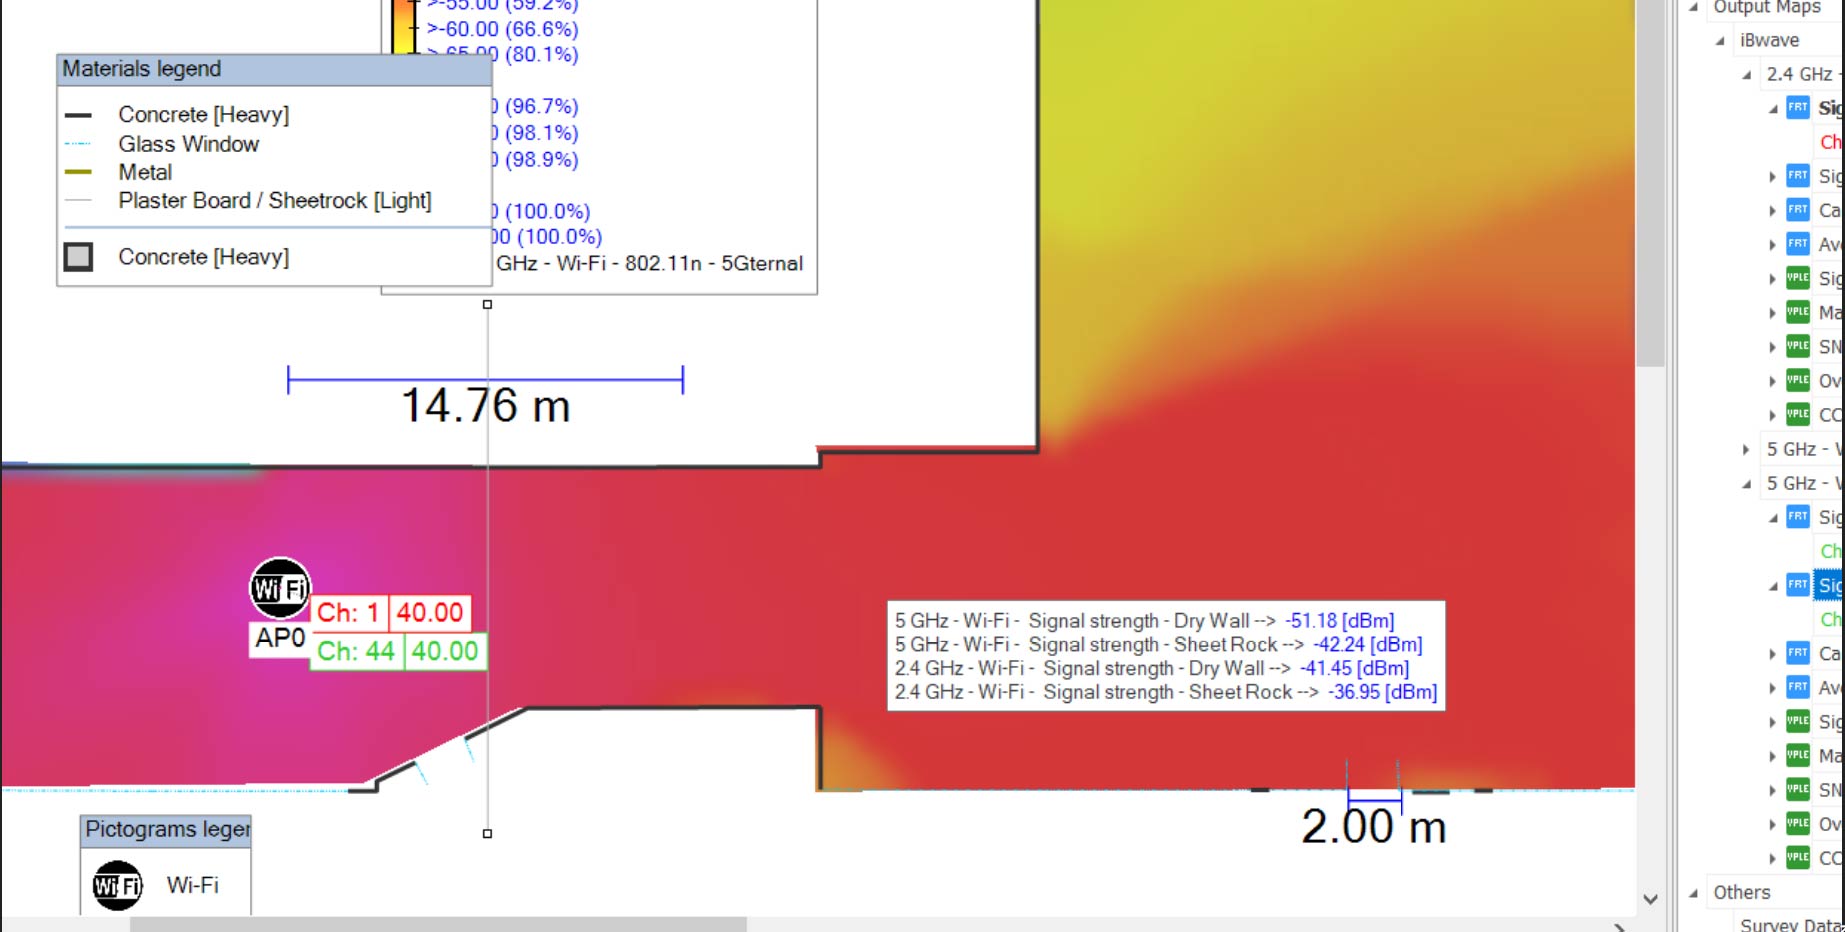
Plaster
And last but not least, I tested the same scenario selecting Dry Wall vs. Sheetrock (Light) to see what the potential impact on prediction might be – and while not as drastic a difference in this example, a difference can still be noticed, more so on the 5GHz band.
| Dry Wall (dBm) | Sheetrock (Light) (dBm) | Delta (dB) | |
| 2.4GHz | -41.45 | -36.95 | 4.5 |
| 5GHz | -51.18 | -42.24 | 8.94 |
Visual of the Different Signal Strength Heatmap Results
In Conclusion…
It was fun to dive into the attenuation values a bit more and how they can potentially impact the network prediction results of a network design. And in fact, it is part of the conversation many of our customers talk to us about when it comes to modeling accuracy – the more accurate the modeling is, including materials and attenuation values, the more accurate the design and prediction results will be. One of our customer CTS, discussed this point among a few others in a previous blog post about how modeling errors can lead to RF performance and cost issues.
Read: How Poor Modeling Can Impact RF Performance and Costs
If you made it this far, I hope you found it interesting – let me know if you have any comments or questions!
Wirelessly yours,
Kelly
Kelly Burroughs has worked in the wireless industry over the last 8 years in a variety of roles. Her background in product, marketing, and wireless jokes makes her a triple threat in the industry. When she’s not busy trying to improve the wireless survey & design experience for customers, she can be found writing wireless jokes that make even the most dedicated network engineer smile (or roll their eyes).
- The Enterprise Guide to Better Cellular Connectivity - June 11, 2026
- Cleared for Takeoff: Private Networks in Aviation - January 21, 2025
- A Tour of iBwave Viewer - November 23, 2020


The theory is good, appreciate it. There is a small correction on the paragraph where you are comparing 5 and 2.5 GHz FSL prediction, you had interchanged the Rx Level values. -33.46 and -28.89.
I came here looking for data on signal attenuation for traditional plaster (i.e. plaster and lath) walls since googling shows many charts for more modern drywall (sheetrock/gypsum board) walls and plasterboard but not for actual plaster and lath. Even more useful would be the signal attenuation data for plaster with wire mesh. Unfortunately, the info provided on this page was useless in that regard despite the term plaster used on this page. In addition, it seems that the wall material chart is useless in another way too. There is no indication as to the difference between drywall, sheetrock (heavy), sheetrock… Read more »
Even though not all variants of materials are listed this is a very useful article.
In the office that I work there are some windows with metal reinforcement by 1x1cm squares. It’s really good at killing WiFi propagation.
have you also looked at the new “6GHz” band (5950-7125MHz) and how the attenuation compares to the “5GHz” band? So generally taking the middle of the new “6GHz” band such as 6.5GHz? This is of interest. I expect some additional attenuation but not dramatically compared to the 5GHz band. But I am not sure.
This is a very interesting report. You found attenuation values significantly higher than the 1997 report from the NIST which looked at attenuation in common construction materials (e.g. concrete) for the frequency range 0.5 to 8 GHz.
https://www.nist.gov/publications/electromagnetic-signal-attenuation-construction-materials
Attenuation should come in dB (not dBm).