
A Tour of iBwave Viewer
Share
Available for many years and compatible with all our software, iBwave’s free read-only viewer is a popular go-to for the customers of our customers to review survey and design work done on their projects. In this blog I’ll take you on a quick tour of what it can do.
An Overview of iBwave Viewer Features
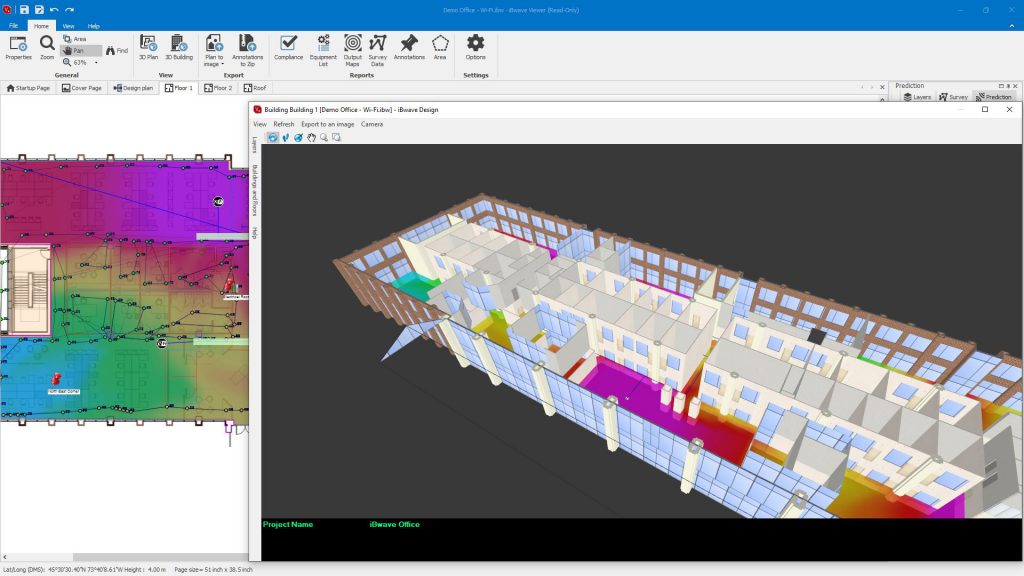
When you open iBwave Viewer it looks similar to other iBwave software – similar interface, similar menus – but functionality itself is limited to read-only. But this doesn’t mean the customer can’t do anything with it – it just means access is limited.
Here are the features I cover in detail below.
- Reviewing Designs in 2D & 3D
- Generating Reports
- Analyzing Survey Data
Reviewing Network Designs
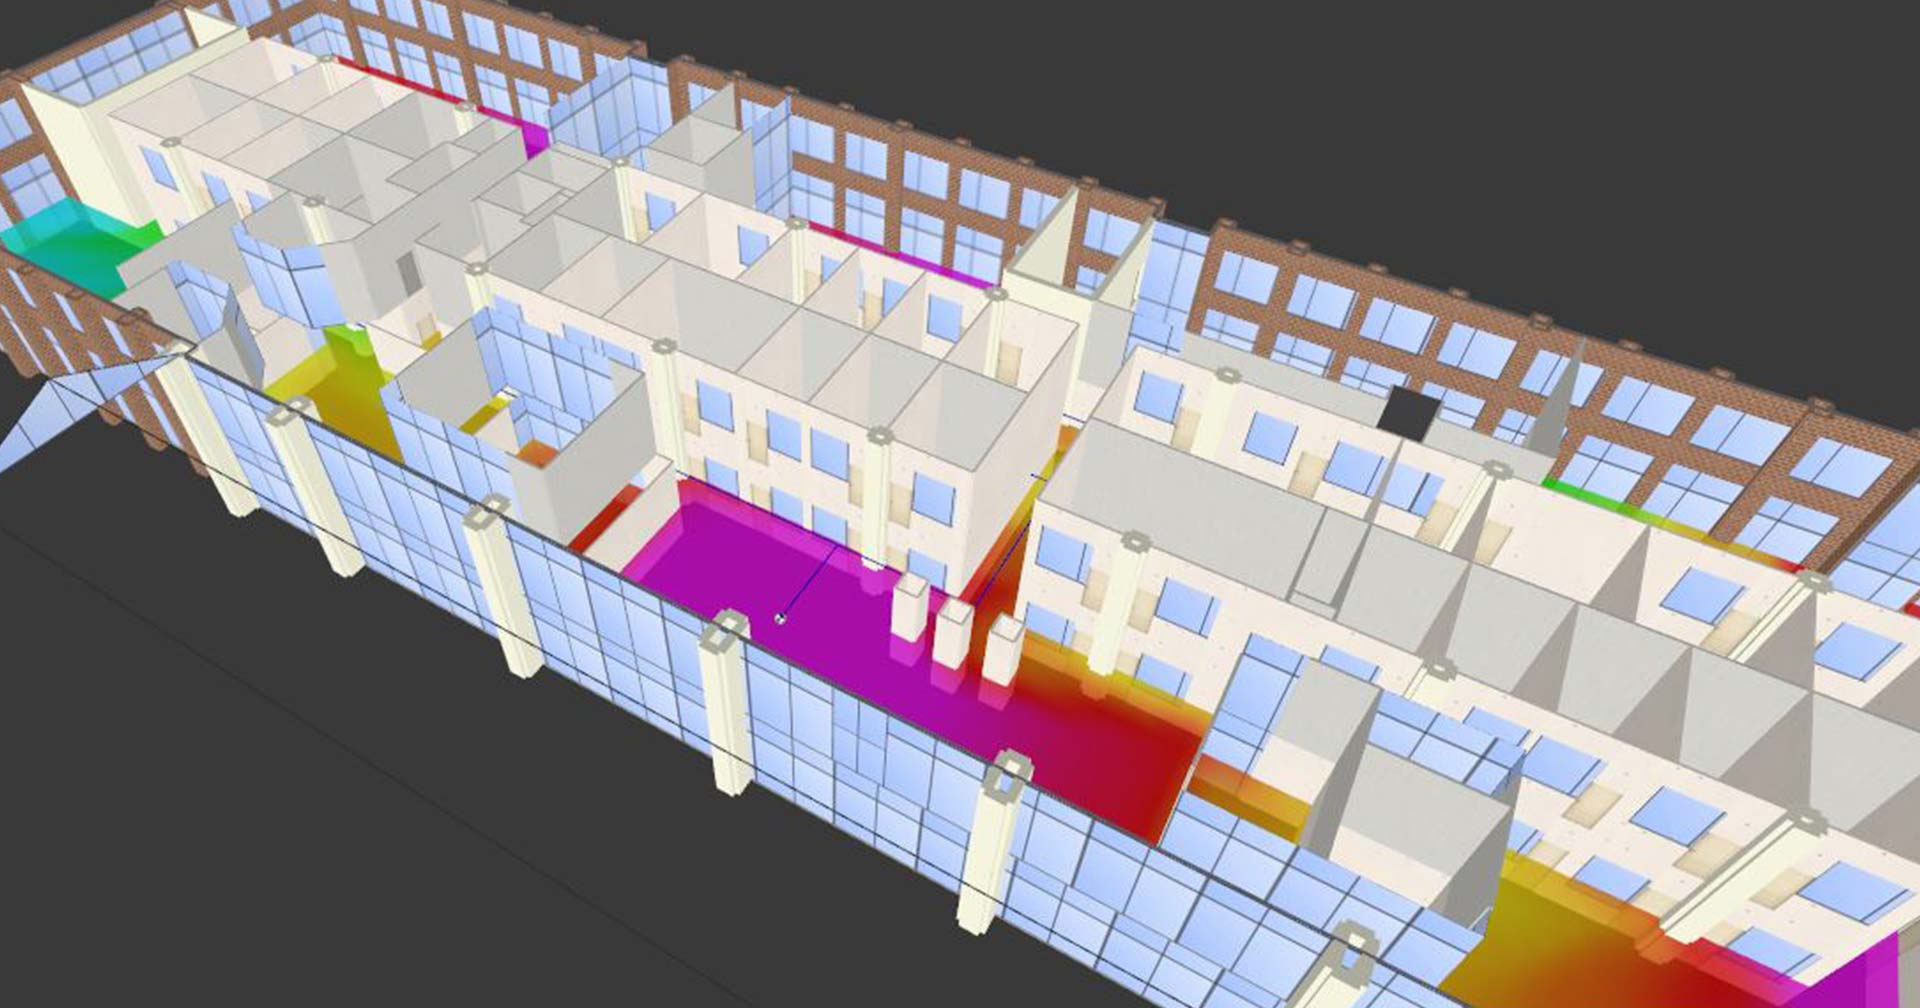
With iBwave Viewer, you can review any iBwave design as read-only in both 2D and 3D. For many customers, the ability for their customers to view the design in fully 3D gives them the benefit of a powerful visualization showing both exactly where location will be placed within the venue, as well as a strong visual of how the network will perform. For those who are not technically trained in RF, the ability to see their venue in 3D, to see where radios, cabling and network equipment will be placed is a powerful visual to gain approval faster.
As an example, here I open a warehouse design and you’ll see I can’t do anything to the design but I can view the overall design plan (network diagram), view the design in 2D, view any images/videos/notes saved to the pushpins, select and view different heatmaps and then generate a 3D visualization of the design/heatmap to “walk through the building”.
Generating Reports
While those using iBwave Viewer cannot make any updates to the design, they can generate a limited number of reports which may be relevant for their review. Specifically, they have access to generate and export the following reports:
- Compliance Report
- Equipment List (Bill of Materials)
- Output Maps Report
- Survey Data Reports
- Annotations Reports (handy for installation team to review)
- Area Report
In this short video I generate the BOM, Compliance Report and Output Maps report.
Analyzing Survey Data using iBwave Viewer
With iBwave Viewer you can also view and analyze survey data for both Cellular and/or Wi-Fi, depending on what you collected during the site survey. Survey analysis capabilities include the ability to view the survey interpolation heatmap (separate from prediction heatmap), and then filter and view data for single, multiple or all SSID, BSSID or Channels. You can also run a survey data report for selected buildings, floors, SSIDs and bands. This is perfect for those who just use our latest survey app – iBwave Mobile Survey – to only do surveys with but do not have accompanying software to review and analyze the data. With the free viewer they can simply import the data and use Viewer to analyze it with.
In this video I walk you through the above, showing an example of a 5GHz survey trace.
Want to Try It Out?
iBwave Viewer is free and readily available on our website (with sample projects) for free. Give it a try by downloading it here.
That’s it, hope you enjoyed the blog!
Wirelessly yours as read-only,
Kelly
Kelly Burroughs has worked in the wireless industry over the last 8 years in a variety of roles. Her background in product, marketing, and wireless jokes makes her a triple threat in the industry. When she’s not busy trying to improve the wireless survey & design experience for customers, she can be found writing wireless jokes that make even the most dedicated network engineer smile (or roll their eyes).
- The Enterprise Guide to Better Cellular Connectivity - June 11, 2026
- Cleared for Takeoff: Private Networks in Aviation - January 21, 2025
- A Tour of iBwave Viewer - November 23, 2020


