Why we Migrated from HSPA to LTE Sooner than we Thought
Share

UMTS data rates evolved over the years from 3.6 Mb/s in 2005 (HSPA), to 21.1 Mb/s in 2008 (HSPA+) and finally to 84.4 Mb/s in 2010 (HSPA++). The 84.4 Mb/s data rate is very similar to data rates that can be achieved using LTE technology under the same circumstances (10 MHz RF channel, 2×2 MIMO). When in 2009 Verizon Wireless announced the plan to migrate to 3GPP and deploy LTE in 2010, a lively debate ensued among the incumbent North American 3GPP operators. The topic was whether higher data rates should be achieved via migration to HSPA+ and HSPA++, or if imminent migration to LTE is warranted.
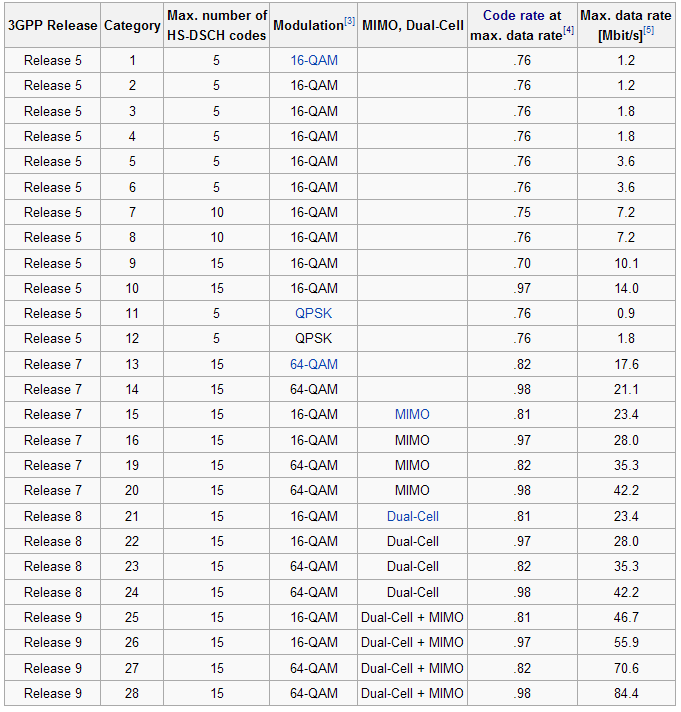
The consensus at the time (2009) was that since similar data rates may be achieved by either technology, migration to HSPA+ and later to HSPA++ was the natural choice because migrating to HSPA++ does not require major network upgrade. However, that changed in 2010 when ATT announced that it will deploy LTE within a year. Indeed, first ATT LTE markets were launched in mid 2011. The purpose of this paper is to examine if HSPA++ data rates indeed can compete with LTE data rates, or if slower than expected data rates could be a reason behind faster than expected LTE deployment. Let’s first examine maximum physical data rates for HSPA (Category 1-12), HSPA+ (Category 13-14) and HSPA++ (Category 14-28):
Listed maximum physical data rate is always less than what the so called “application data rate” which is what is measured in the field. Typically, application data rate is 80-85% of the listed maximum physical data rate. However, for the sake of clarity, we will assume that application and physical data rates are identical.
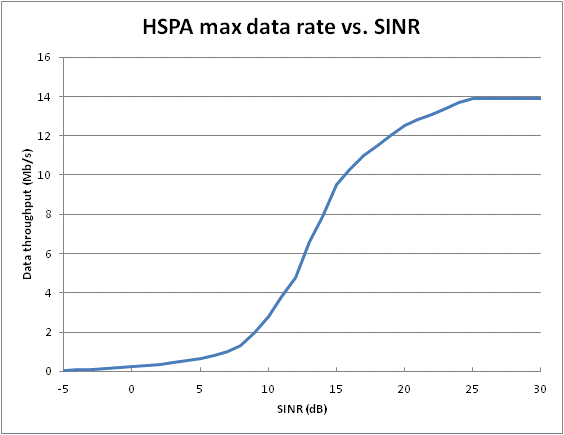
Maximum physical data rate can only be achieved under favorable conditions with excellent signal quality. At UE, several key performance indicators (KPI) can be measured to determine signal quality: received signal power, data rate, CQI and signal to interference and noise ratio (SINR). Establishing relationships between measured KPIs may prove to be very useful when designing RF networks. For example, if we know the relationship between SINR and HSPA data rate, then we can produce HSPA data rate coverage map if SINR coverage map is known. We can determine SINR vs. data rate relationship by measuring those two KPIs in the field, and then curve fitting the data. The graph below shows a typical relationship between the two:
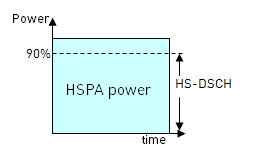
We see that maximum data rate of 14 Mb/s is achieved only for SINR ³ 25 dB. This is very high SINR value, so let’s examine whether it can be achieved in realistic deployment scenarios. HSPA signal consists of two components: traffic signal (HS-DSCH) and control signal (HS-SCCH and HS-DPCCH). Control signals are allocated 10% of the total power transmitted by Power amplifier. If HSPA does not share power amplifier (PA) with another technology, then 90% of the PA power is allocated to the traffic signal, HS-DSCH:
Now let’s examine a well-known HSPA SINR formula:
WHERE Pown is own (serving) cell interference, Pother is non-serving sector power,
α is orthogonality (0.5 for macro, 0.85 for indoor networks),
PHS-DSCH is received power summed over all HS-DSCH codes,
Pnoise is received noise power and
SF16 is spreading factor of 16.
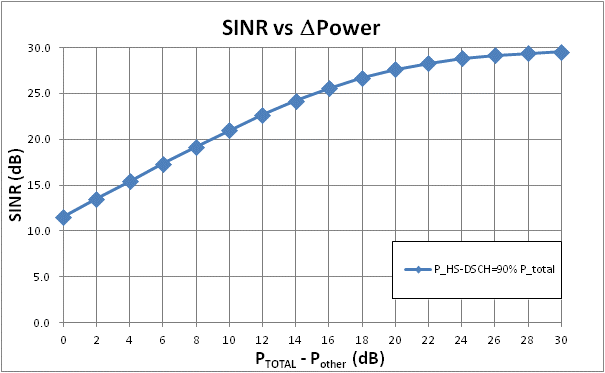
If HSPA is deployed with dedicated PAs, then PTOTAL = PHSPA and PHS-DSCH / PHSPA = 0.9. If we assume a mature system where (1- α)Pown + Pother >> Pnoise, then we have the following relationship between SINR and the difference between serving sector (PTOTAL) and non-serving sector (Pother) power:
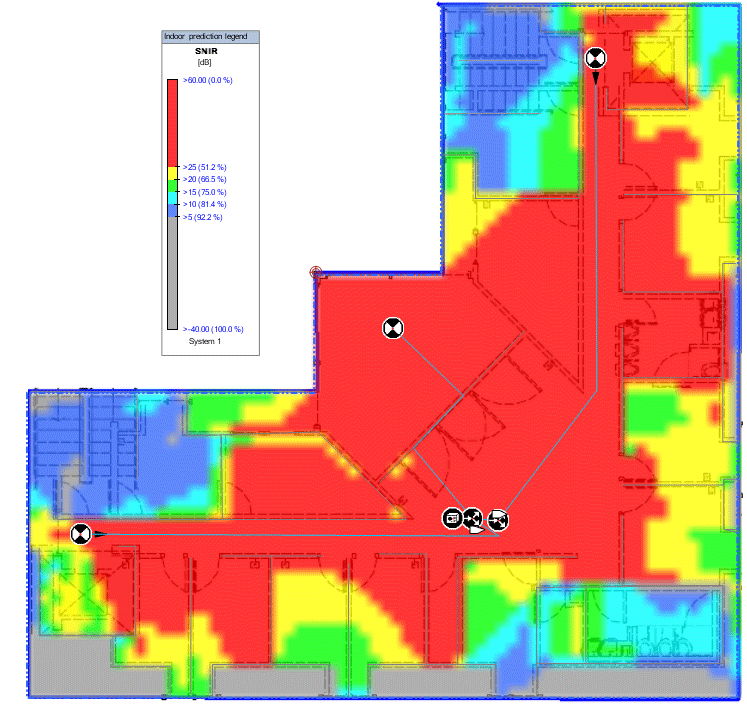
From the graph, SINR ≥ 25 dB IS achieved if the power differential is greater than 16 dB. While ΔP ≥ 16 dB is very stringent requirement in a macro network, it can be readily achieved in an in-building network with modest outdoor macro interference. In a figure below, we show in-building SINR coverage where SINR > 25 dB is shown in red:
The red area covers approximately 50% of the floorplan, which is also the area over which the maximum data rate of 14 Mb/s is achievable. This simulation was done under the assumption that outdoor macro signal level is -85 dBm just outside the building, and that transmit power at the three antennas is between -8 and -11 dBm EIRP per channel. Therefore, we see that under those realistic assumptions we may expect to achieve the maximum data rate over about 50% of the floorplan.
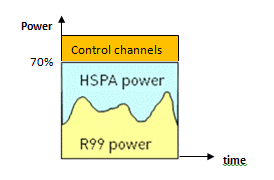
Let’s take a look at what happens if HSPA shares power and spectrum channel with WCDMA (R99), which is typical UMTS network deployment. WCDMA (R99) has control channels, which take 20% of the available power. Taking into account 10% for HSPA control channels, we see that 30% of the total power is allocated to control channels. Remaining power is shared dynamically between WCDMA and HSPA:
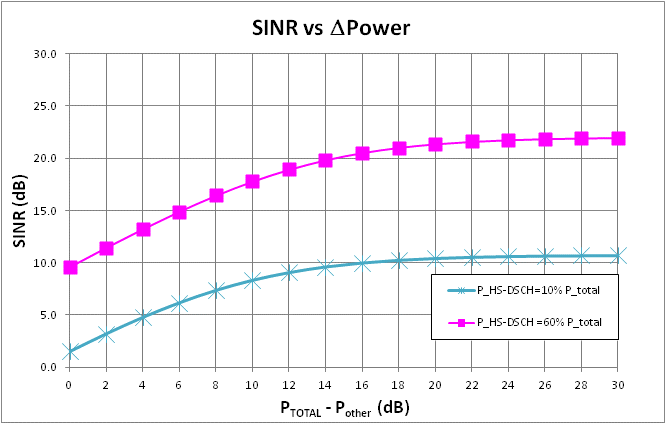
Since power is shared dynamically between the two technologies, the ratio of HSPA power to total serving power PHS-DSCH / PTOTAL varies in time, between 0% and 70%. If we assume that at least 10% of the total power is always allocated to R99, and that at least 10% is always allocated to HSPA, then 10% ≤ PHS-DSCH/ PTOTAL ≤ 60%. Consequently, we would get a family of SINR vs. ΔP curves that are bound by those minimum and maximum values. Let’s revisit the HSPA SINR vs. ΔP plot under those assumptions:
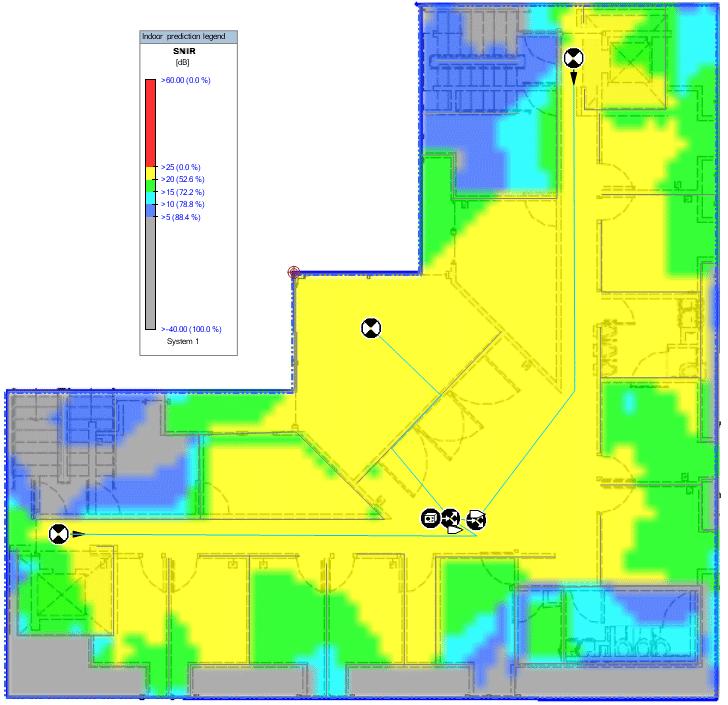
We see that even in the most favorable power sharing scenario, when 60% of the total power is allocated to HSPA and only 10% is allocated to R99, SINR does not reach 25 dB. Therefore, we cannot achieve the maximum data rate of 14 Mb/s. To illustrate the point, we first show SINR coverage:
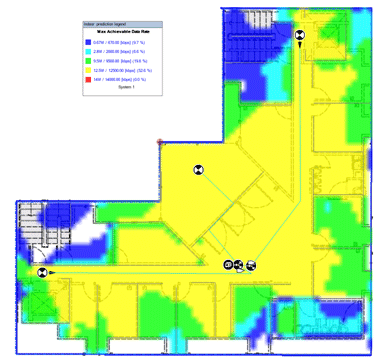
The red coverage area (SINR ≥ 25 dB) has completely disappeared, and is replaced with the yellow coverage area where 20 dB ≤ SINR ≤ 25 dB. This confirms that maximum data rate cannot be achieved even if UE is right next to an antenna. The next picture shows data rates that are achievable under this most favorable power sharing scenario (PHSPA = 60% PTOTAL):
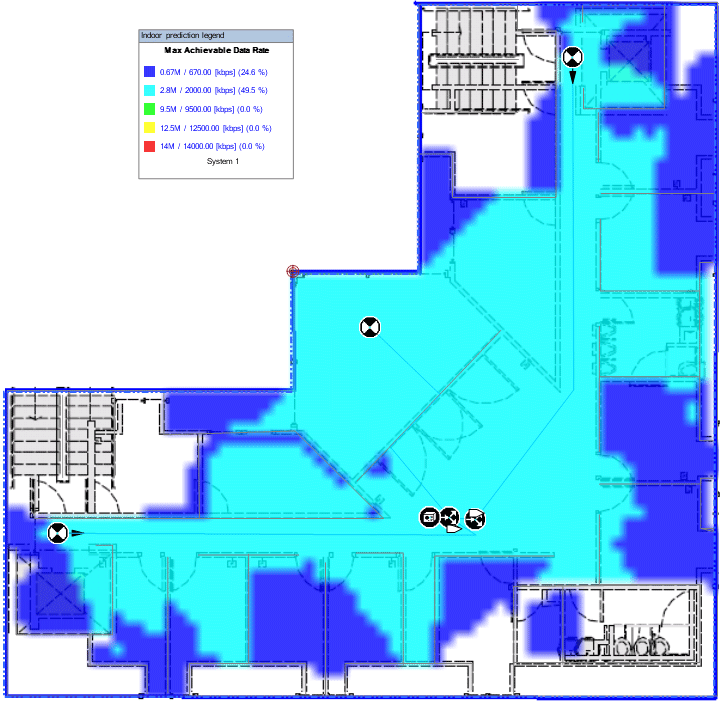
The yellow coverage area is where data rate of 12.5 Mb/s may be achieved, and is approximately 50% of the floorplan. This data rate represents 90% of the maximum data rate achievable in standalone deployment scenario (14 Mb/s). Now let’s take a look at data rates for the worst possible power sharing scenario, when only 10% of the total power is allocated to HSPA:
The light blue coverage area is approximately 50% of the floorplan, and is also the area where data rate of 2.8 Mb/s may be achieved. This data rate is only 20% of the maximum data rate achievable in standalone deployment scenario.
While the exact maximum achievable data rate depend on the ratio of R99 to HSPA user traffic, the above examples show upper (12.5 Mb/s) and lower (2.8 Mb/s) limit of HSPA data rates in shared PA deployment scenario. Most of the time HSPA data rate is going to be in between those two extreme values, in the 5-9 Mb/s range. This is still well below the advertised data rate of 14 Mb/s. Likewise, instead of getting advertised HSPA++ data rate of 84.4 Mb/s, we will be constrained by upper and lower limit of 75 Mb/s and 17 Mb/s respectively. Most of the time, our UE will be able to achieve data rates in the 35-50 Mb/s range, even if our UE is located right next to an antenna.
While reviewing these examples, let’s keep in mind that they were done in indoor environment, where mobile phone may get very close to the antenna, and where good isolation between serving (indoor) and non-serving (macro) NodeB’s greatly limits interference. This is to say that these are favorite RF conditions compared to RF macro environment. Yet, even under those conditions, only 50% of the floorplan could achieve the highest data rate. Further, the inherent limitations imposed by power sharing scenario between HSPA and R99 could not be offset by bringing antenna closer to the user. Finally, the data rate reduction that comes with the prevalent UMTS deployment strategy does not happen in LTE, because there is no resource sharing in LTE. This may be a reason why 3GPP wireless operators moved to implement LTE a bit sooner than expected, after initially claiming that HSPA++ and its “LTE-like” data rates provide cheaper alternative to their network evolution.
- Wi-Fi Design Strategies in a Converged World Webinar Questions Part 4: Industry Related Questions - December 4, 2017
- Wi-Fi Design Strategies in a Converged World Webinar Questions Part 3: iBwave Products - October 5, 2017
- Wi-Fi Design Strategies in a Converged World Webinar: Your Questions Answered. - August 9, 2017

