
The Impact on Prediction of Modeling Body Loss in High-Density Venues
Share
Forever on a quest to improve the accuracy of network predictions in our software, we recently released a new feature called “Body Loss Modeling.” With Body Loss Modeling, you can now account for the attenuation caused by bodies packed into a tight space together in your design – most useful for high-density venues like stadiums, arenas, or conference centers.
In this blog, I use the design of a basketball arena to examine the impact the body loss modeling feature can have on the prediction results of a network design.
I do that by isolating a small section of the arena seating, placing an Access Point and then looking at the results of both the Signal Strength and SNR heatmaps under two scenarios:
- No Body Loss Modeling
- With Body Loss Modeling
At the end, I’ll summarize the comparison and discuss the potential impact of the results.
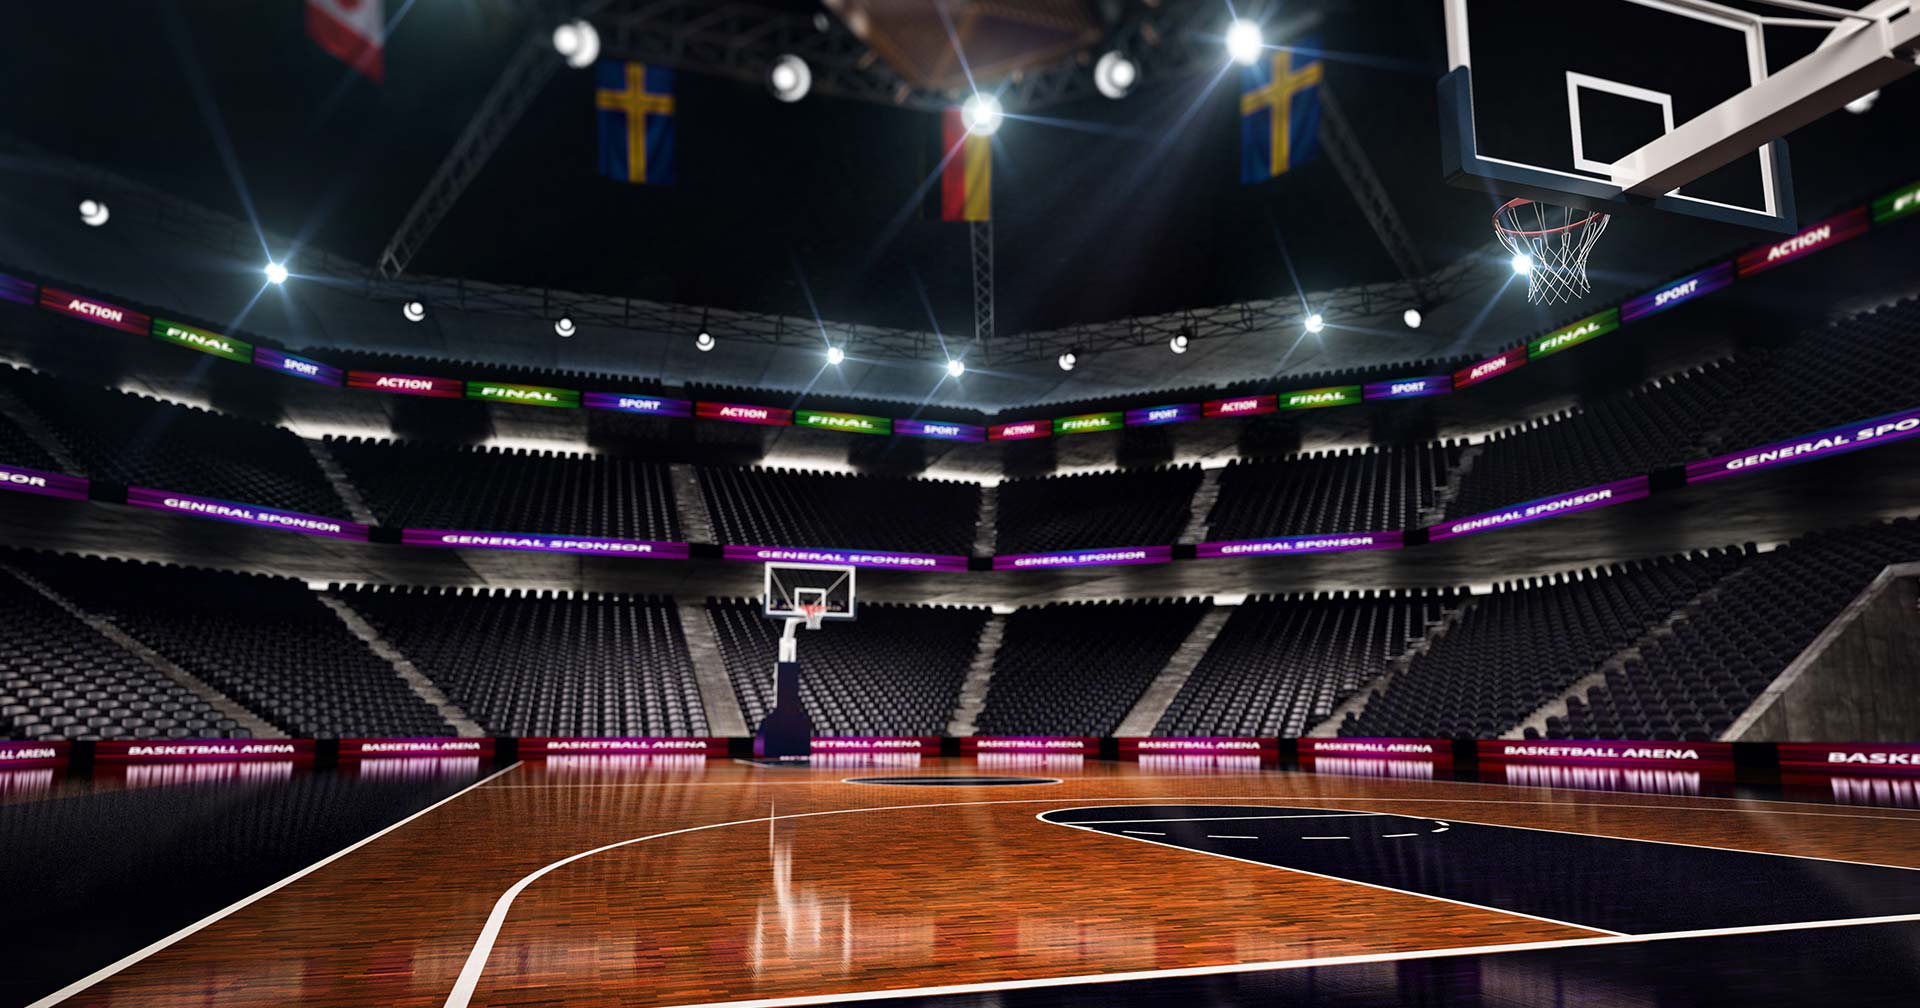
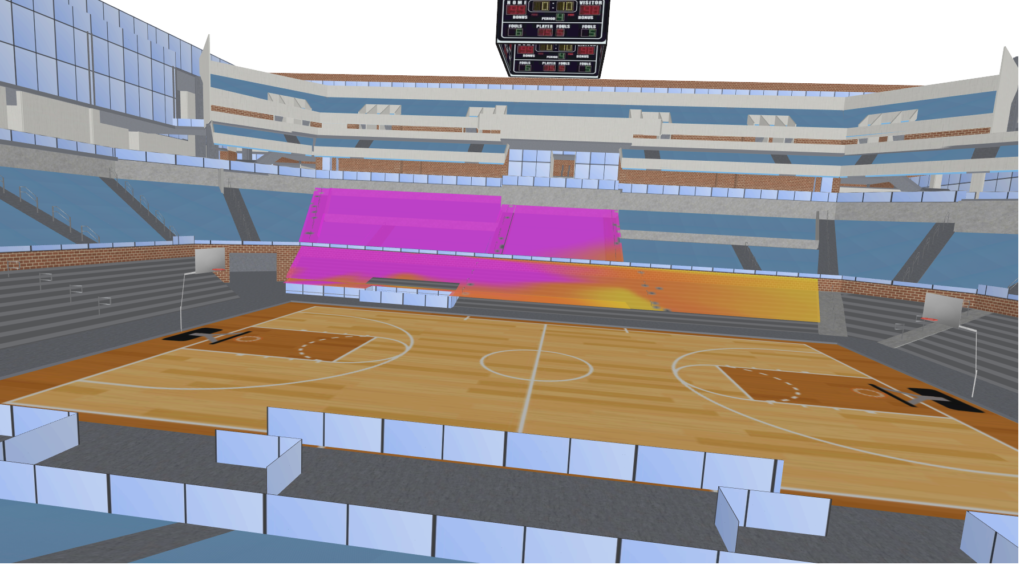
Here is the basketball arena I am using, and the specific seating area looked at in this blog.?
Results: No Body Loss Modeling
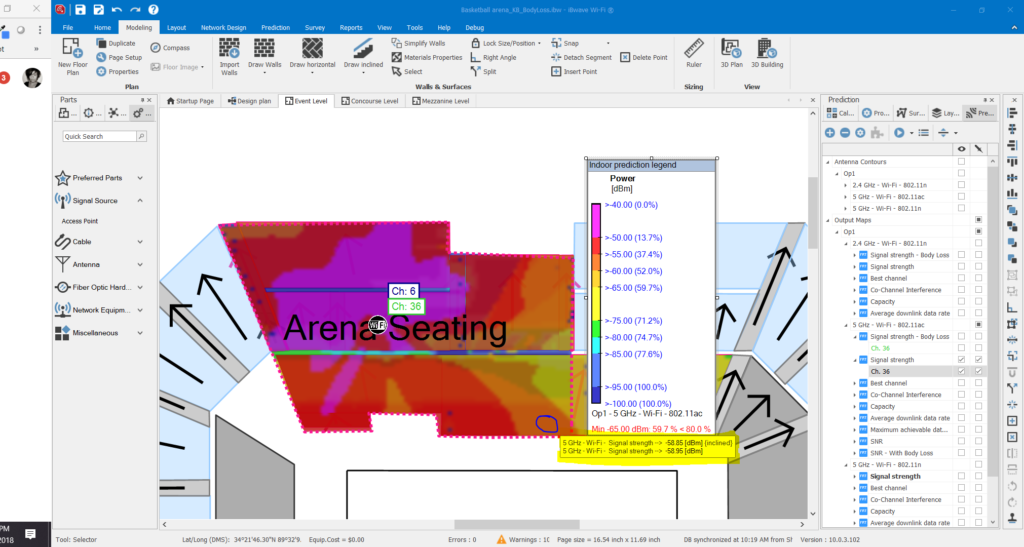
Keeping the prediction zone identified as a regular prediction area, I ran the Signal Strength and SNR heatmaps for the 5GHZ band and then used the “Probe” tool to zone in a very specific seating area in the bottom right hand side of the prediction zone (circled).
Here are the results.
Signal Strength Heatmap Results
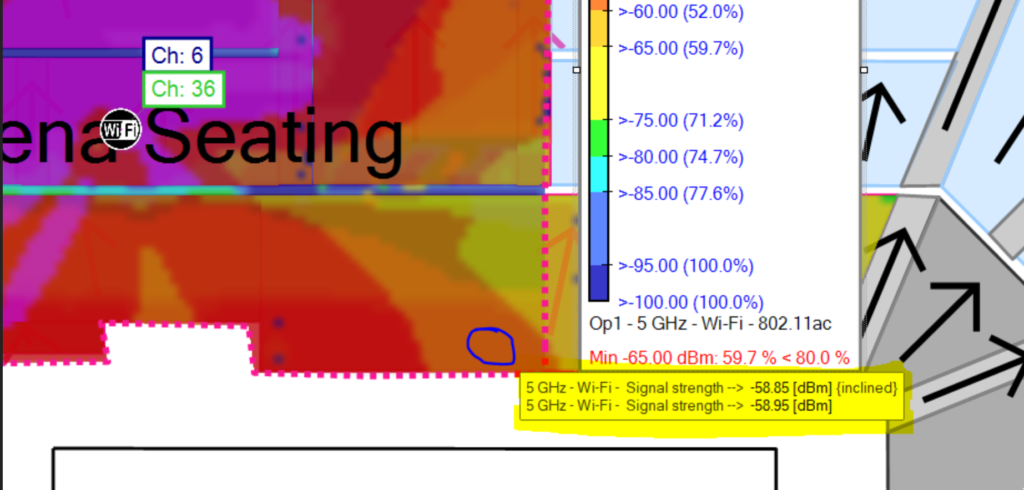
- 58.85 dBM {Inclined Surface Area}
- 58.95 dBM {Horizontal Surface Area}
And zoomed in… ?
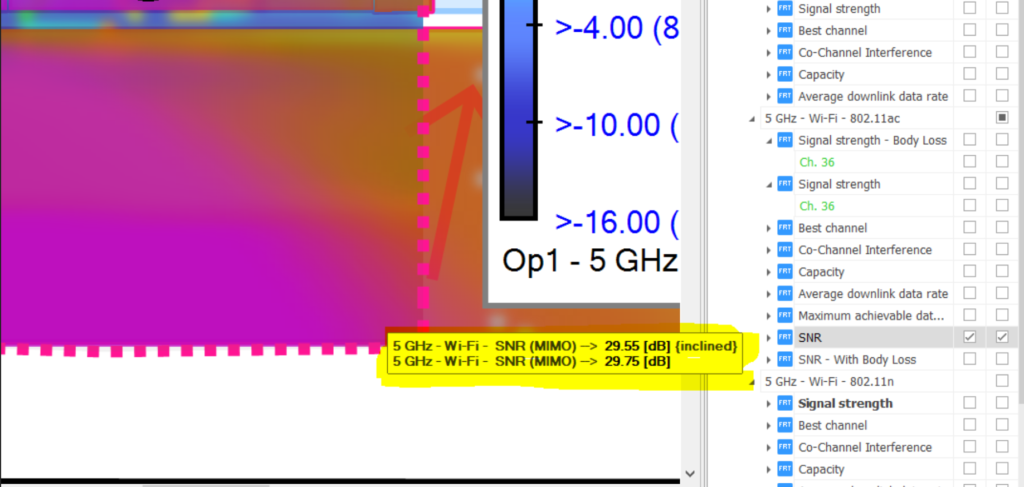
SNR Heatmap Results
- 29.55 dB (Inclined)
- 29.75 dB (Horizontal)
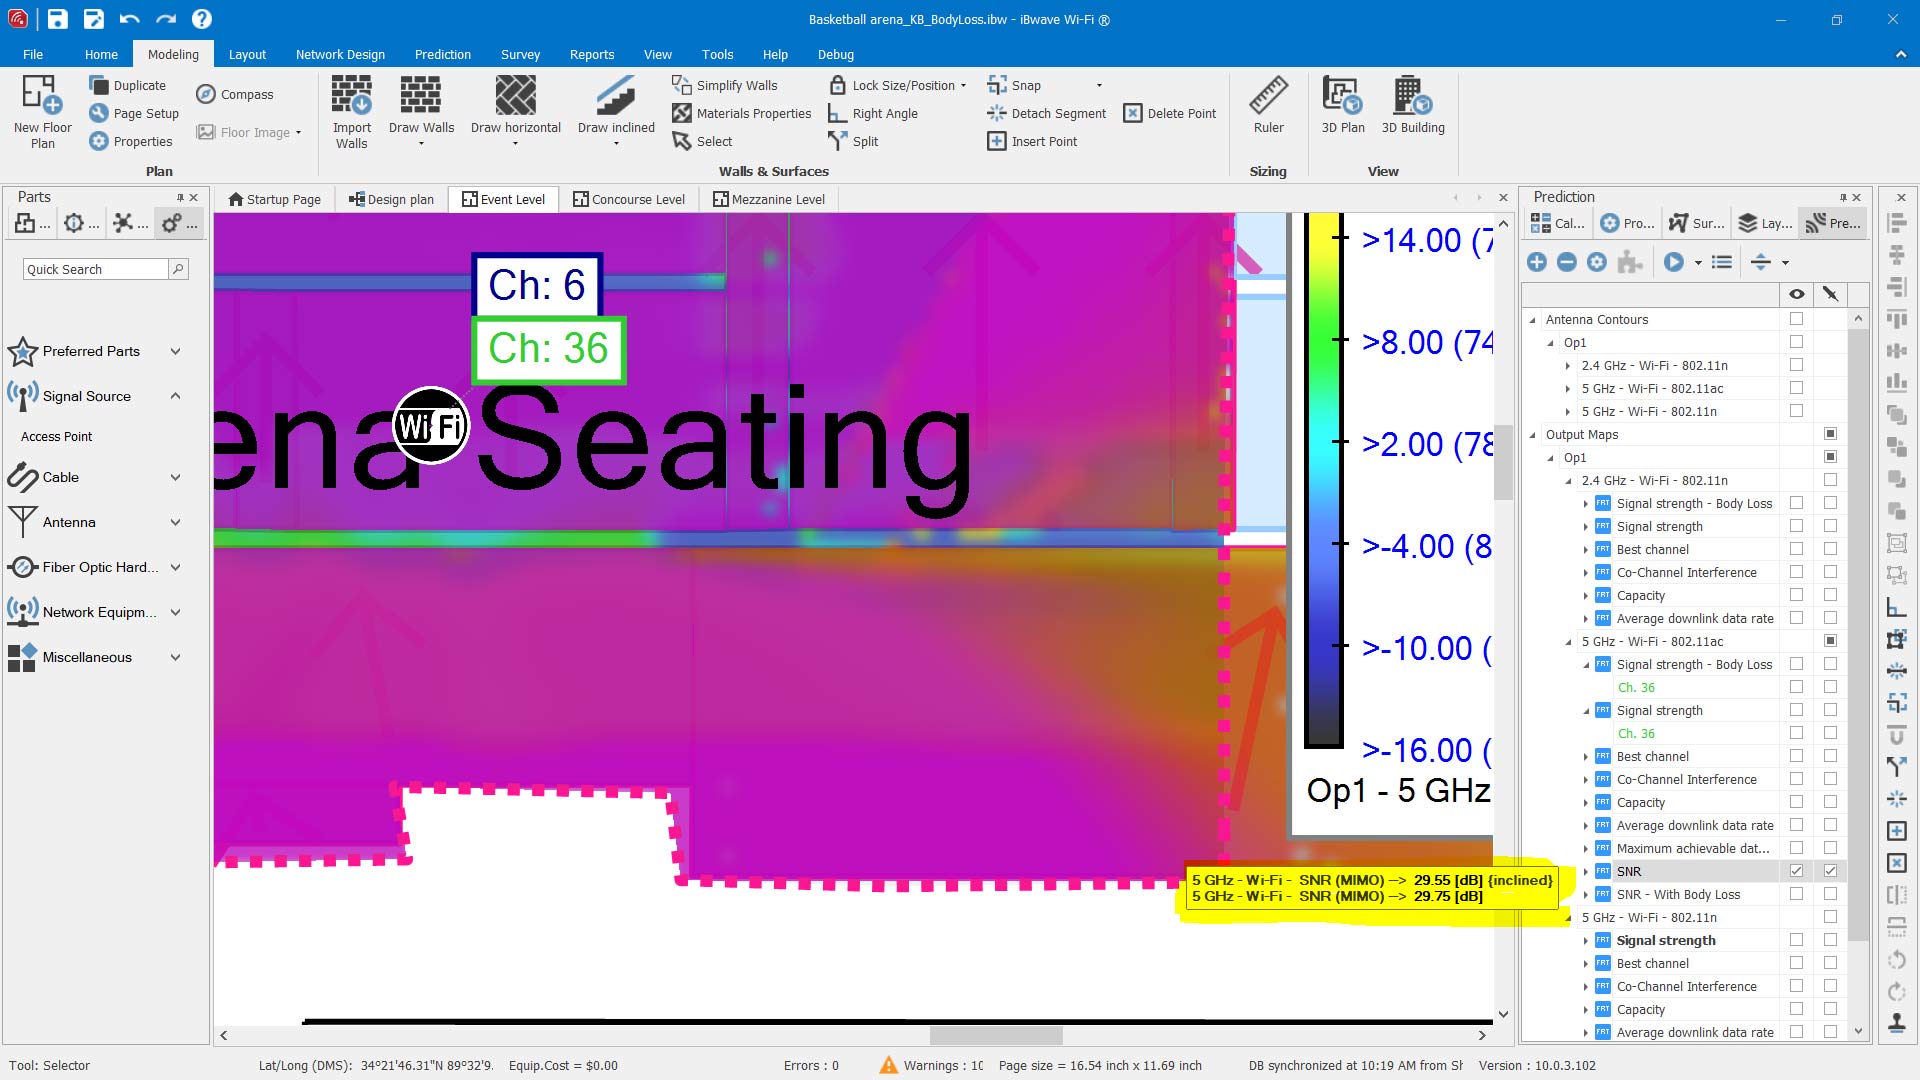
And zoomed in …?
Results: With Body Loss Modeling
Next, I assigned the same prediction area as a ‘Body Loss Zone’ and then re-ran the Signal Strength and SNR heatmap prediction results. To identify a body loss zone in iBwave Wi-Fi or iBwave Design, you have to first configure the ‘Body Loss Zone’ (unless you just want to use the default), and then assign your prediction area as that particular body loss zone.
Here is the configuration I set up and called ‘Arena Seating’ ?
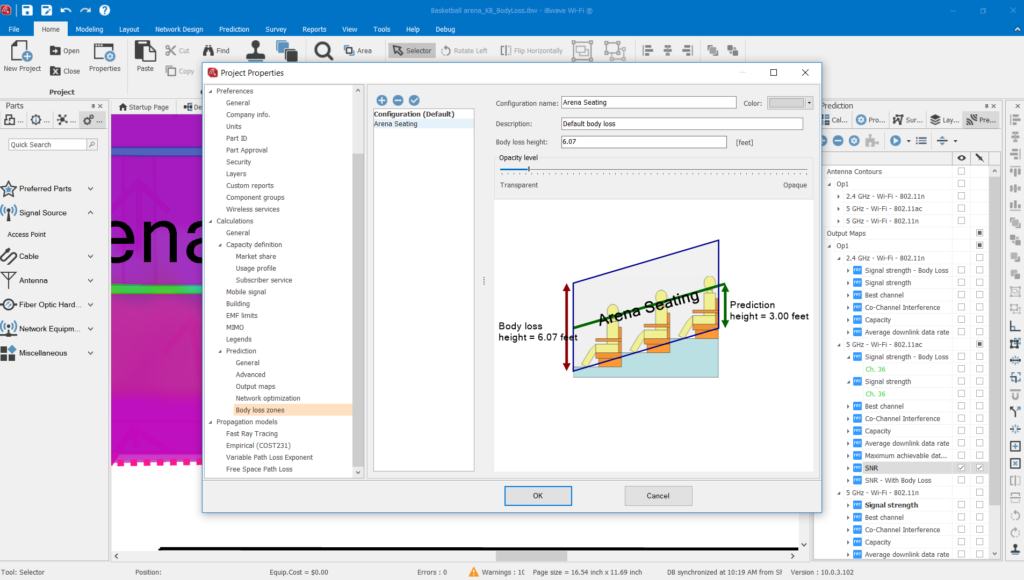
And here is how I assigned the prediction area as the body loss zone I configured above. ?
With the prediction area now identified as a ‘body loss’ zone, the prediction engine will factor in attenuation caused by tightly packed bodies within that seating area.
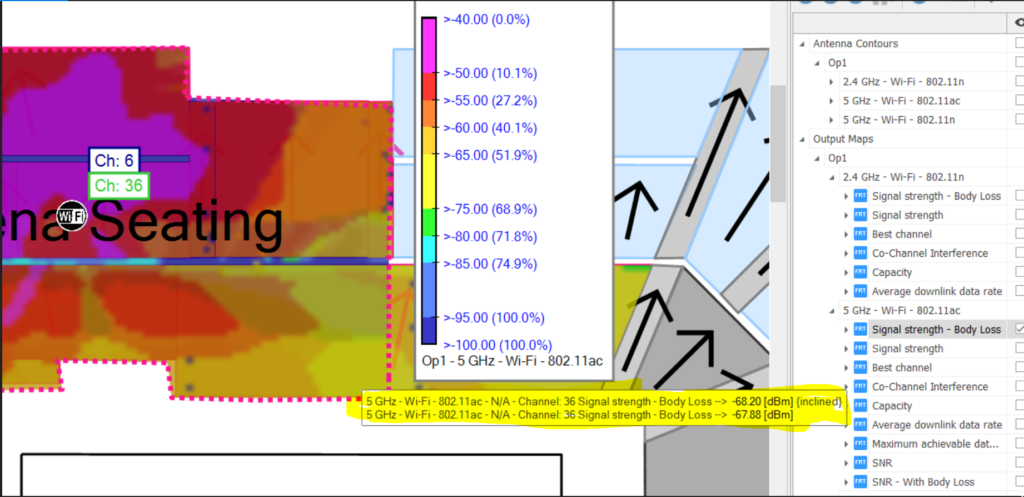
Here are the results ?
Signal Strength Heatmap
- Incline Surface: 68.20 dBm
- Horizontal Surface: 67.88 dBm
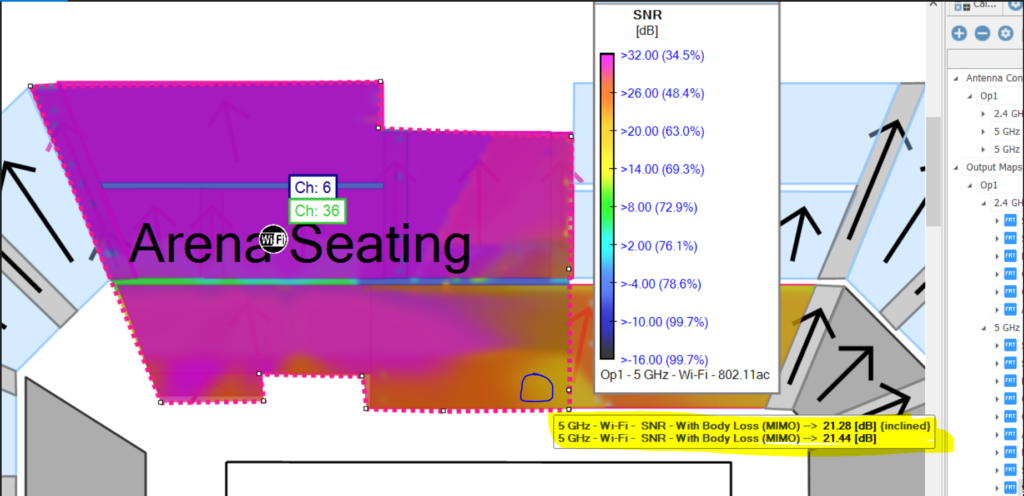
SNR Heatmap
- Incline Surface: 21.28 dB
- Horizontal Surface: 21.44 dB
Comparing Results
To easily compare the prediction results with and without body loss factored in, I put the results into a table.
| No Body Loss | With Body Loss | The Difference | |
| Signal Strength | 58.85 dBm | 68.20 dBm | -9.35 dB |
| SNR | 29.55 dB | 21.28 dB | -8.27 dB |
Looking at the table, you can start to see the potential impact that modeling bodies in high-density environments can have on the accuracy of prediction results – and thus on the potential performance of the network post-installation.
In this case, before I modeled body loss into the design, the signal strength is predicted to perform pretty decently with a 58.85 dBM signal strength. With the attenuation due to bodies factored in, the signal strength loses almost 10 dB, which pushes it towards a much less desirable signal strength and could significantly impact the user experience when it comes to critical applications like video streaming or VoWiFi.
Looking at the SNR heatmap, a similar story is supported, even emphasized – before body loss is considered, the SNR sits at a pretty acceptable level of 29.55 dB. After body loss is factored in, the SNR level drops to 21.28 dB – making it even more likely that those critical apps will work as expected for the user.
For the network engineer designing the network, this means she or he needs to factor in that while prediction results without body loss factored in can show acceptable performance results, it could be misleading in high-density venues – which can lead to undesirable and costly consequences later on.
When prediction during the design phase is not accurate, it can lead to more site visits post-install, and possibly re-design work which is all more downtime and cost for the property owner.
How do you factor in body loss into your wireless designs? Let me know in the comments below.
Wirelessly yours,
Kelly
Interested in learning more about iBwave Wi-Fi? Read more about it here, or try out a 15 day free trial.
Kelly Burroughs has worked in the wireless industry over the last 8 years in a variety of roles. Her background in product, marketing, and wireless jokes makes her a triple threat in the industry. When she’s not busy trying to improve the wireless survey & design experience for customers, she can be found writing wireless jokes that make even the most dedicated network engineer smile (or roll their eyes).
- The Enterprise Guide to Better Cellular Connectivity - June 11, 2026
- Cleared for Takeoff: Private Networks in Aviation - January 21, 2025
- A Tour of iBwave Viewer - November 23, 2020


hi
what did this simulation look like at 1900 or 2500 MHz? I know you ran at 5 ghz so was curious to see the delta for that.
Hi John,
Sorry for the delayed response! We will see similar behavior but based on our measurement campaign, we found that the delta path loss exponent in 2.4GHz is greater than the one in 5GHz. Also, we will run some results on 2.4HGHz and publish them some times soon.
best,
Ali, R&D In Wireless Communication Systems at iBwave
How did you set the FRT parameters in the Propagation Models property? How is the delta Y1 estimated? Thank you.