
Feature Spotlight: iBwave Reports
Share

It’s time for another iBwave Feature Spotlight!
In this piece, we’ll be looking at four key reports within iBwave’s network design software. No, these aren’t the type of reports you submit to a professor. These are automatically generated reports which can provide you with essential information when designing in-building networks.
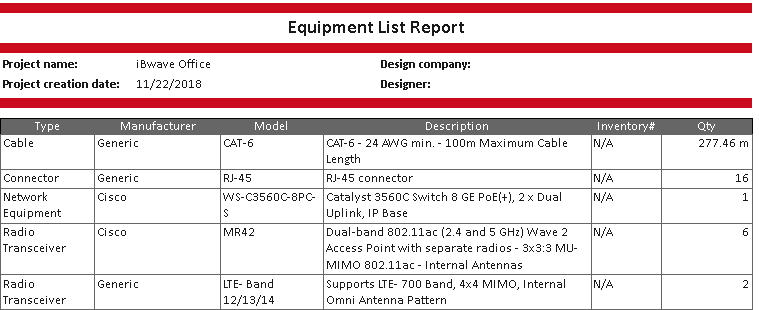
Equipment List
You’ve designed your in-building wireless network and now it’s time to compile a list of all the vendor equipment you’ve used within the design itself. The list might be long: radios, cabling, cable trays, switches, routers, controllers, and so on – in other words, the bill of materials.
You can do it the hard way: manually input each cable, antenna, router and transceiver in a spreadsheet until your eyes glaze over and you’ve aged a decade. Or, you can do it the iBwave way: with the Equipment List Report!
In just one click, the Equipment List Report will generate an overview of all network components required to complete your design. The data can then be exported and shared with project stakeholders in the file format of your choice (PDF, Word Doc, PowerPoint, etc.). Not only does it make it easier for you, your clients will appreciate knowing exactly what equipment is needed to complete their network design.
The bottom line? Manually creating an equipment list is not only time consuming, but also prone to human error. The Equipment List report will help save time on tedious tasks so you can focus on more demanding duties.
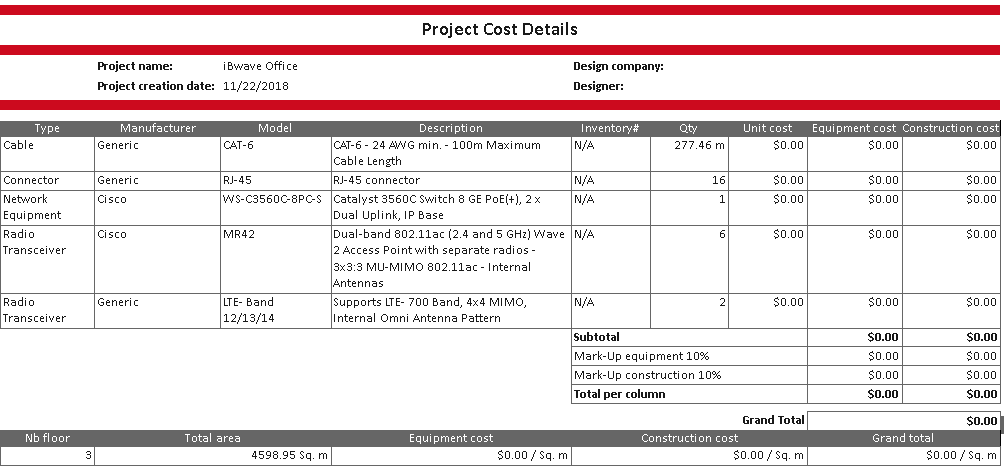
Cost Details
Now let’s talk about everyone’s favorite subject: budget allocation!
You’ve used the Equipment List Report to compile the network equipment needed to complete your design, now it’s time to calculate an accurate cost breakdown with the Cost Details Report. Not only can you use this tool to customize your equipment list to include pricing for each piece of equipment, you can also add additional project costs to the report such as labor and construction costs, mark-ups, and more.
The Cost Details Report also gives you control over what information you share with your customers and project partners. Keep things on a need-to-know basis by choosing whether mark-up percentage or construction costs are visible to your client or not on the final report. And just like the Equipment List Report, you can extract your Cost Details Report in the file format most convenient to your company and customers.
Leave the numbers to us. iBwave’s Cost Details Report will make short work of complex calculations.
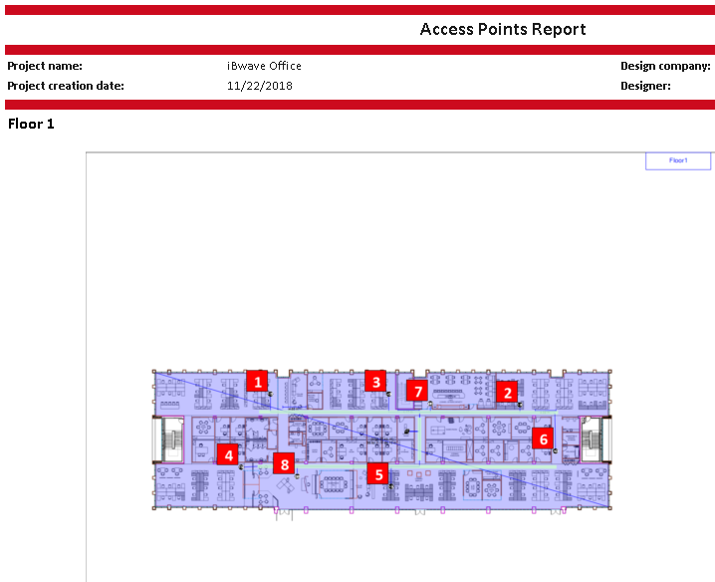
Access Points
Your building wants wireless access and wants it NOW! But before you go placing access points in every nook and cranny of your network, try iBwave’s Access Points (AP) report.
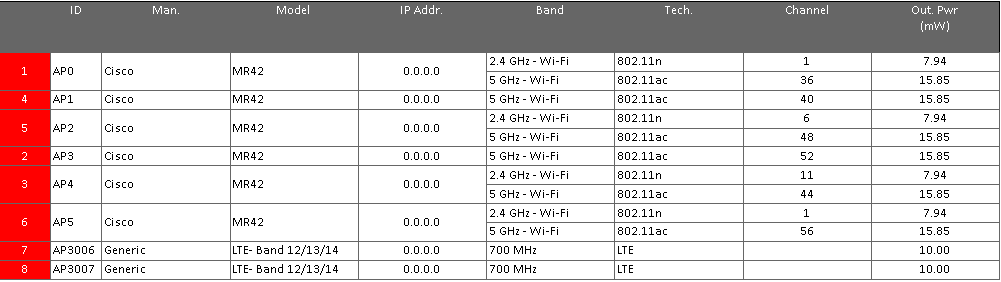
The AP report will give your customers an all-in-one document that outlines everything they need to know about their building’s AP placement. In addition to displaying the location of APs on your building’s floor plan, it will also tell you which channel and band your access points are operating on. You can share the report with the design and installation teams in multiple file formats so they can be easily reviewed.
Many of our customers have seen first hand how the Access Points report saved them both time and money. If the goal is to have complete wireless connectivity in your in-building network design, give the Access Points report a whirl and see how easy it can be to accomplish.
Output Maps
Some people just want to look at pretty pictures.
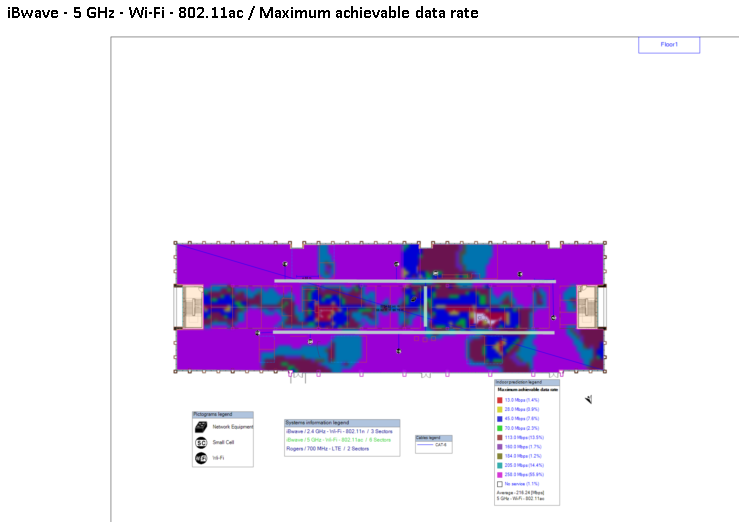
iBwave’s Output Maps Report generates heat map visualizations that convey everything you need to know about your in-building wireless design, all in one convenient document.
But these pictures aren’t just pretty, they’re essential! The Output Maps Report will display heat maps of your network design’s predicted performance, providing useful information such as the network’s average data throughput rate per user, signal strength, SNR, co-channel interference and capacity pass/fail rates. It even allows separate heatmaps based on frequencies used, so you can compare the output of 2.4 GHz vs. 5 GHz and add KPI requirements for each as needed.
Just like the Equipment List, Cost Details, and Access Points report, the Output Maps Report exports in the file format of your choice. Notice the trend? No matter the report, you’ll be able to share it easily with those that need it.
These are just a few of the reports iBwave software can generate. In a future piece, we’ll cover another batch of useful reports.
And there you have it! Thanks for reading another installment of the iBwave Feature Spotlight series.
Eclectic writer with a passion for creativity. I love to read comics, draw, and cuddle my cat Pizza.
- Wi-Fi 6: The Key Features - December 6, 2019
- LOL OMG BBQ?! – Understanding Wireless Industry Acronyms - November 27, 2019
- Feature Spotlight: Optimized Inclined Surface Modeling - November 6, 2019


