
3 Features that Increase Prediction Accuracy
Share

There are many things that can throw off the results of a network’s performance prediction during the design phase of a wireless network deployment. Anything from setting the scale a little bit incorrectly, to using the wrong wall material type, to not knowing what is behind the venue’s walls that may impact signal loss, to using flat surfaces where there are incline surfaces – and the list goes on and on. Needless to say, accurately predicting the performance of a network before it goes live, can be hard to do because so many different factors impact it.
Which is why in iBwave software—both iBwave Wi-Fi and iBwave Design—we try to empower users with many capabilities to ensure that the prediction done in the design phase will be as accurately reflect the performance once it goes live, as accurately as possible.
Here are 3 ways to ensure more accurate prediction results using iBwave software.
The Materials Database and Editor
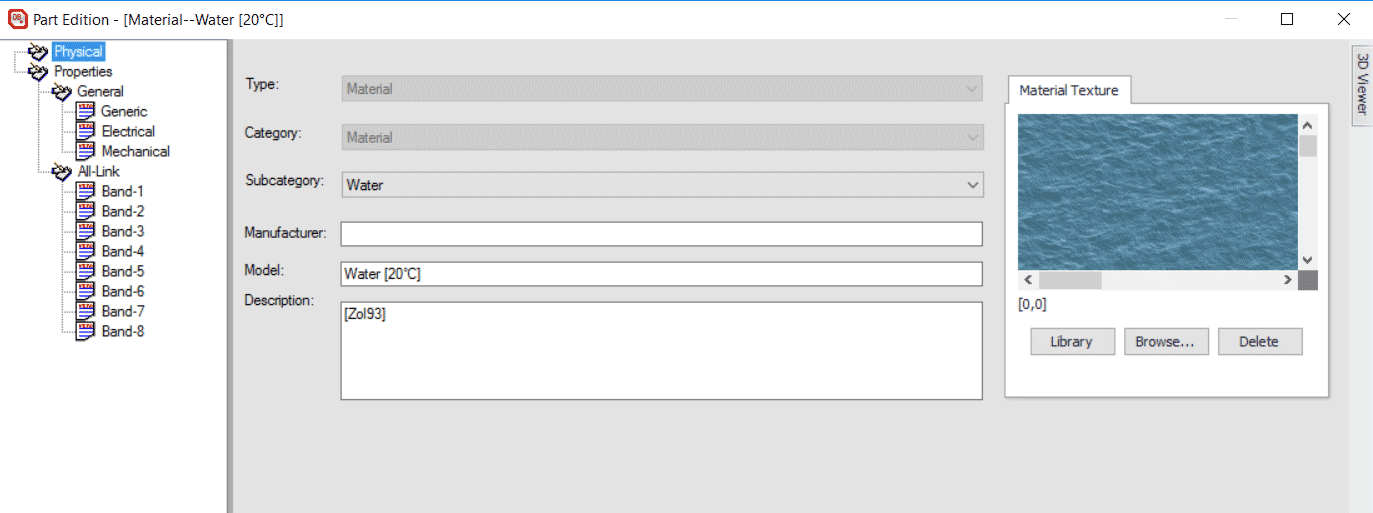
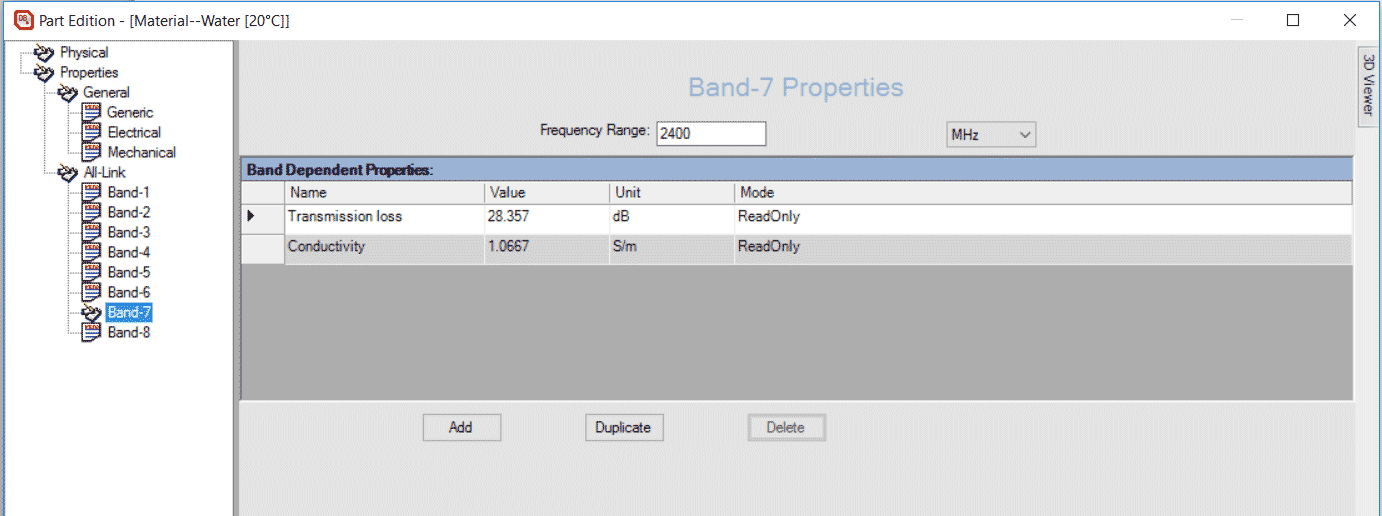
The out-of-box materials database in iBwave Wi-Fi and iBwave Design is extensive (give or take about 85 different defined materials). But we know that all the materials in the default database are the only ones that may be needed during the design of a network. It is often the case that our customers need to add custom materials with differing signal loss configurations to ensure the most accurate representation of the venue they are modeling. So for this reason, we’ve made adding new materials to the database easy for our customers to do themselves. The materials database (and the components database) is fully editable for our customers to add their own materials and allows them enter information such as: transmission loss per band, conductivity per band, a material image (viewable in 3D) and then design properties such as trace color, texture width, height, etc.
Here is an example of one of my favorite materials: Water at 20oC
To read more about how to edit the components database, check out this blog.
Prediction Calibration
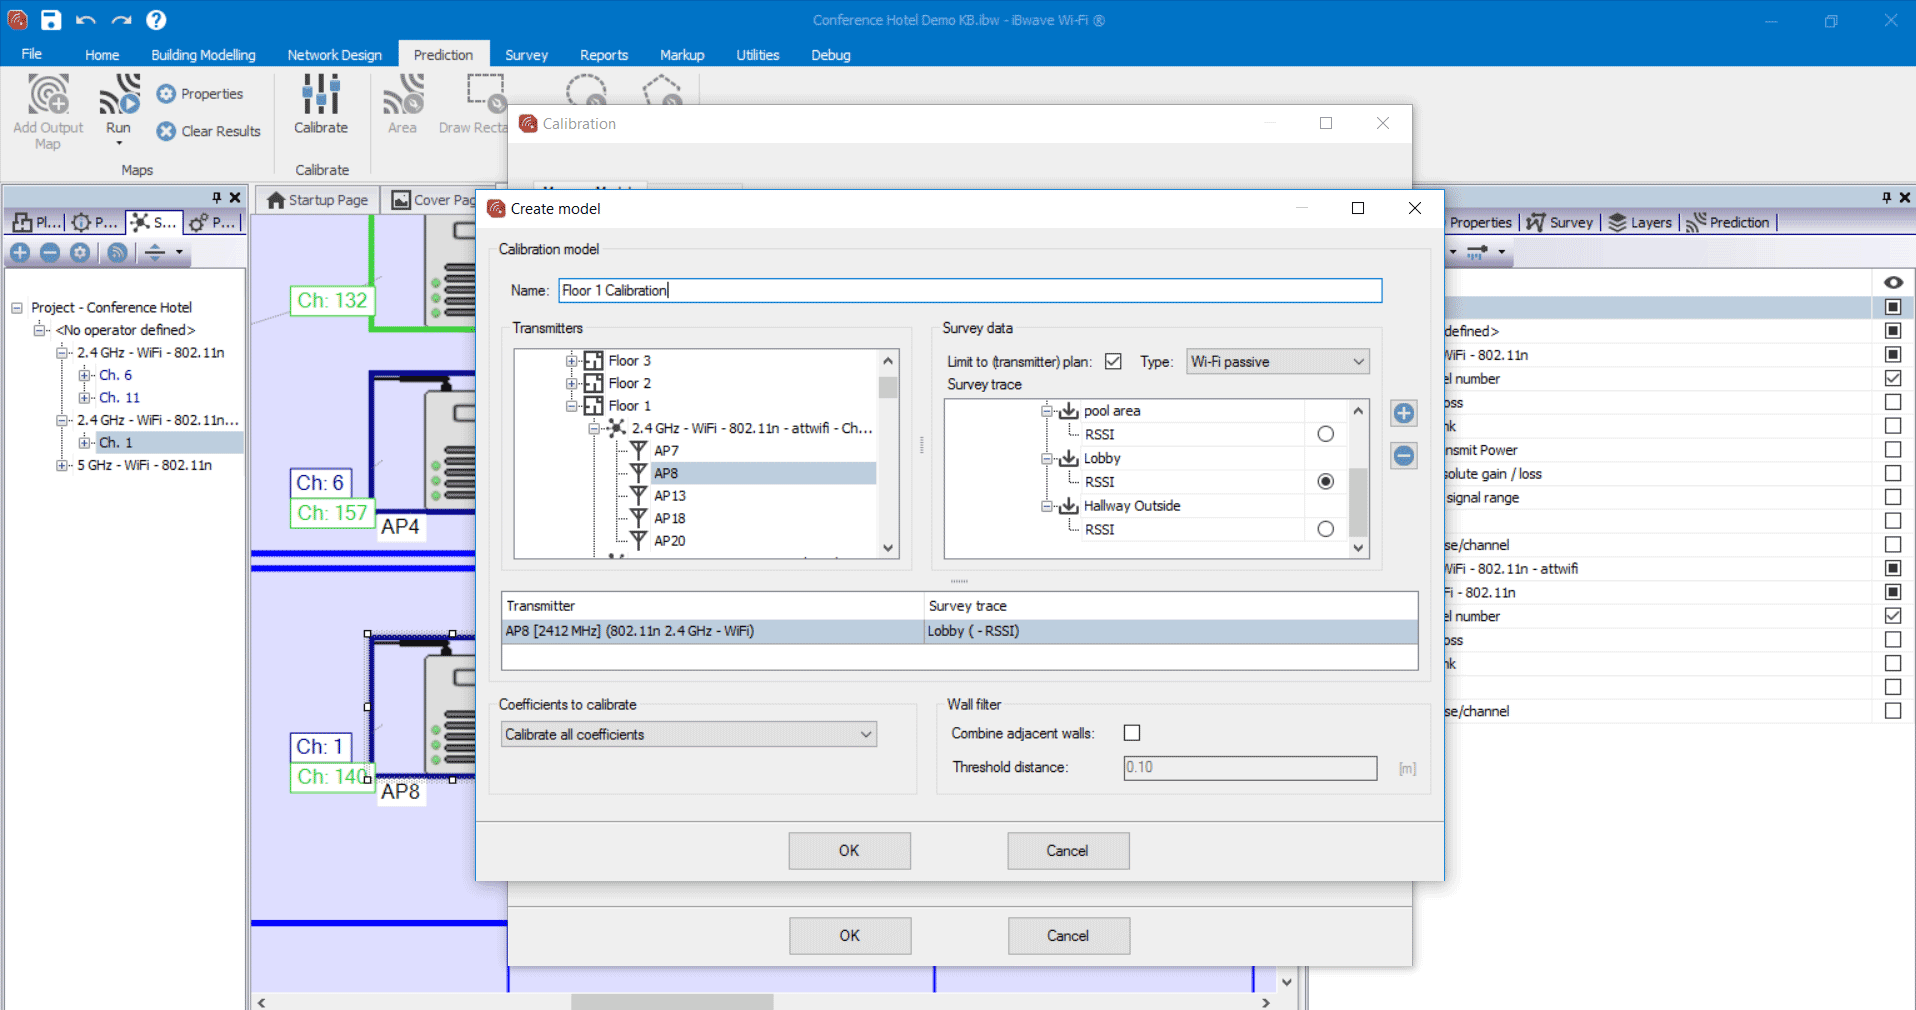
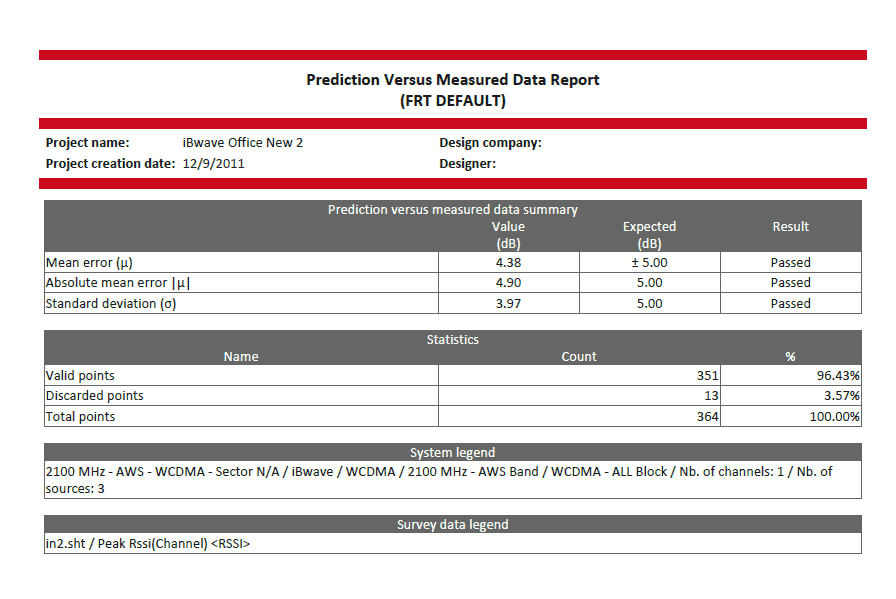
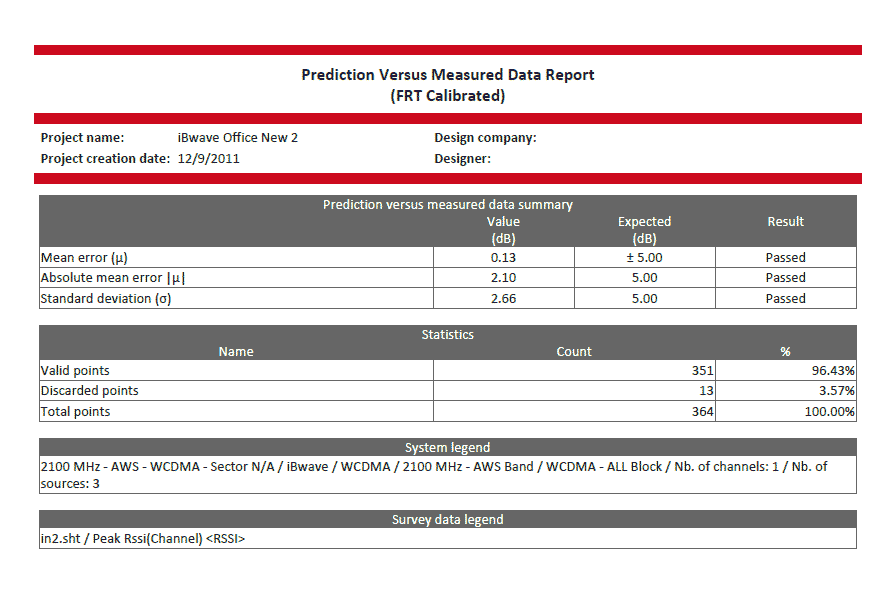
Unique to iBwave when it comes to network design software is the ability to calibrate prediction results with a live reading from the venue. So for example, when designing a Wi-Fi network and you have done an active or passive survey on the site, you can then use the measurement readings to calibrate the prediction. Because while you may have the right wall material selected in the model, you never know what is behind the wall that could impact the signal strength – metal beams, wood, etc. Using a live reading from the site to calibrate gets you that much closer to prediction accuracy. In iBwave Wi-Fi and iBwave Design there is also a ‘Prediction versus Measured Data’ report that can statistically show you the results of prediction versus the live measurement.
Here is a screenshot of prediction calibration, as well as the ‘Prediction versus Measured Data Report’. In these two reports you will see that the mean error, absolute mean error, and the standard deviation prior to calibration are all significantly higher than after we ran calibration using the passive survey measurements.
Incline Surfaces
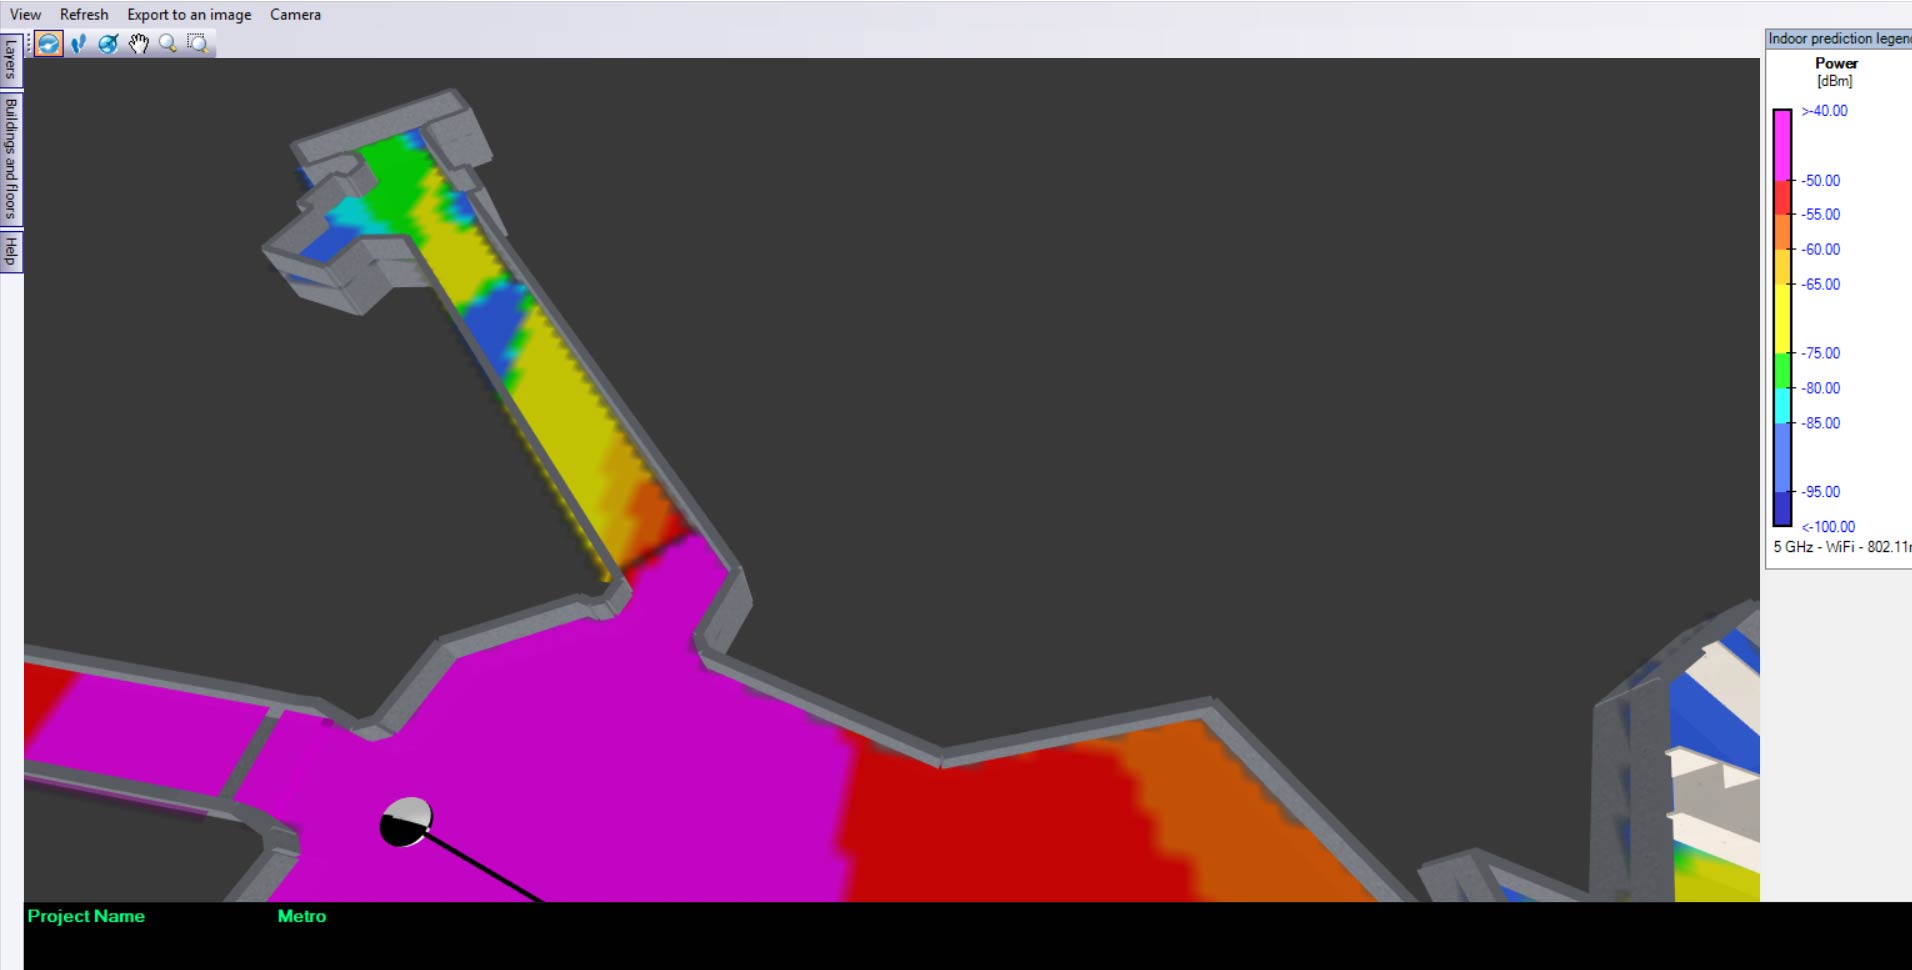
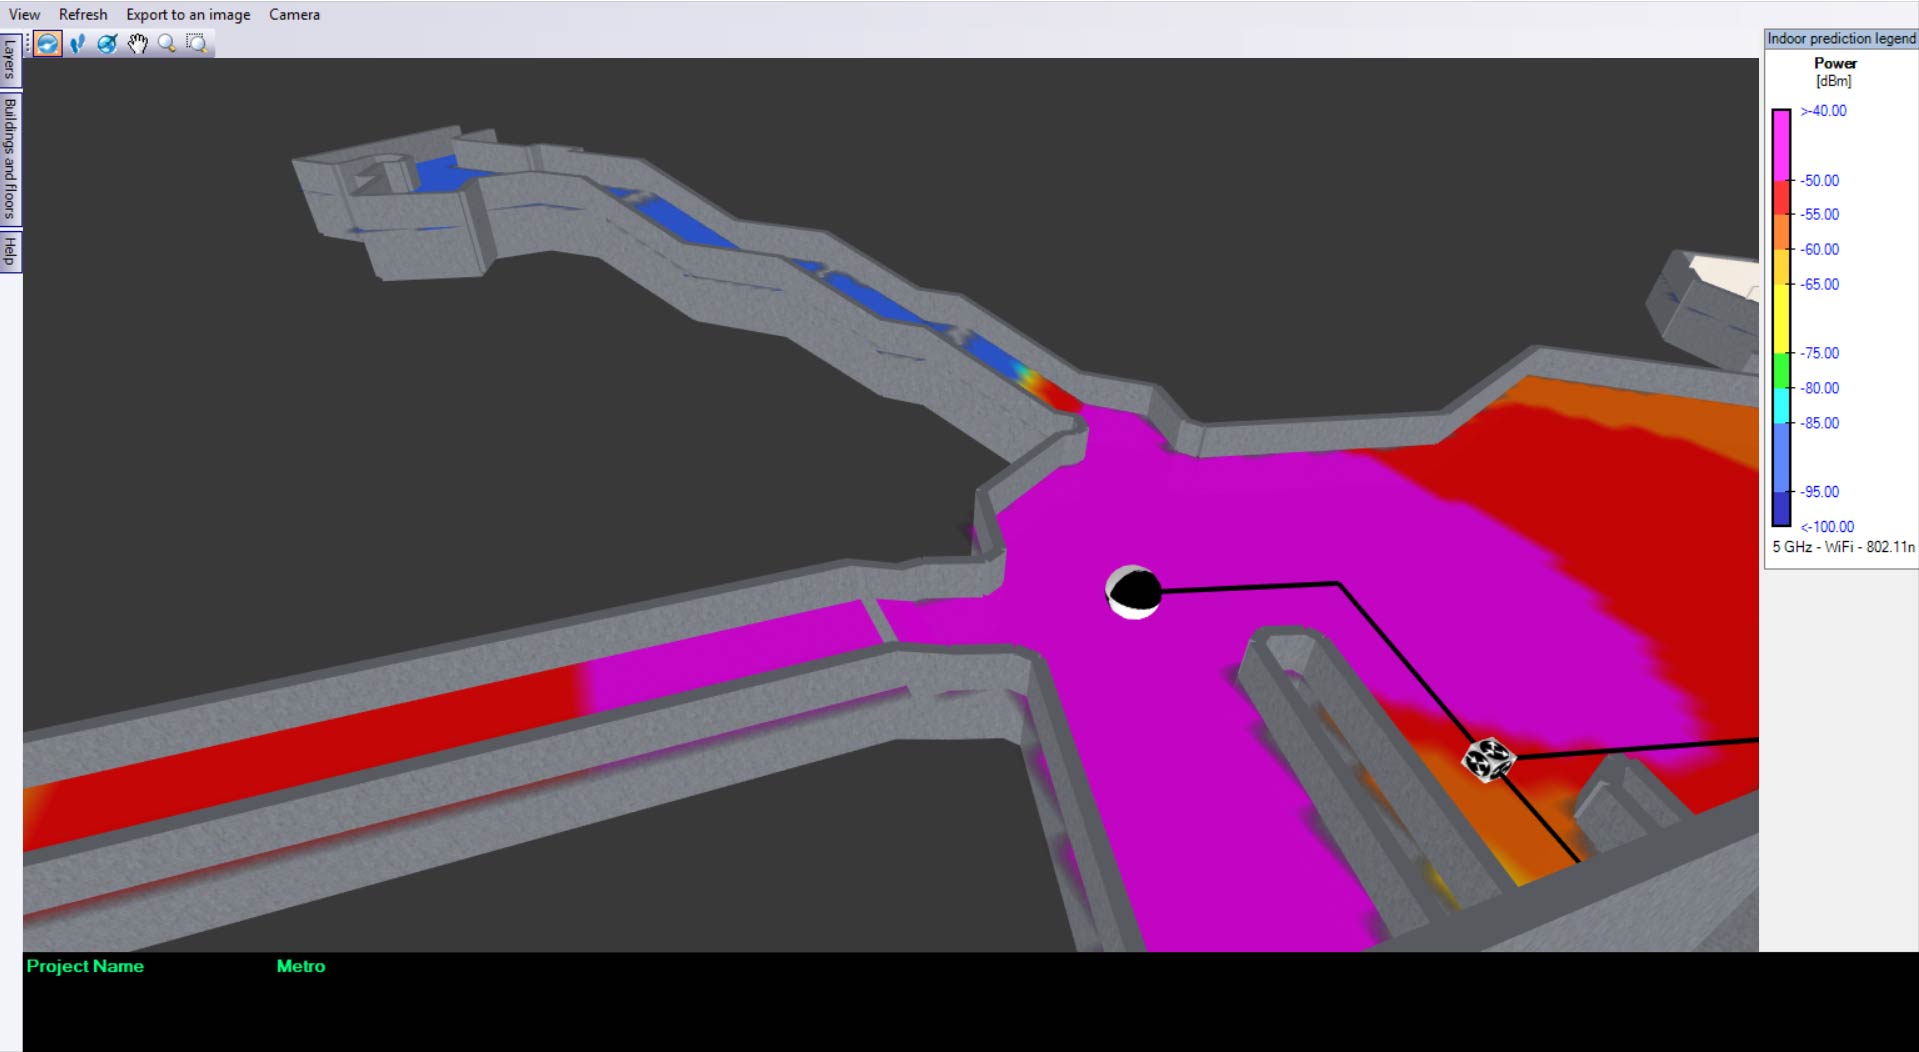
I covered this topic fairly thoroughly in a blog post a couple of weeks ago, but it’s an important factor when it comes to prediction accuracy so I am also including it here. The ability to accurately model incline surfaces for venues which have inclined surfaces (I’m thinking stadiums, shopping malls, airports, subway tunnels, etc) can be invaluable for ensuring the network prediction during the design phase is a realistic representation of how the network will perform post-installation. In the one case study I did using a subway station/tunnel as an example, the difference between using incline surfaces during modeling and not can lead to a prediction difference of about 35dBm – which in reality translated to the users of the network having good signal strength, or none at all.
Here are the screenshots from the subway station example.
What are some other factors you have noticed have a large impact on accurate prediction results?
Wirelessly yours,
Kelly
Kelly Burroughs has worked in the wireless industry over the last 8 years in a variety of roles. Her background in product, marketing, and wireless jokes makes her a triple threat in the industry. When she’s not busy trying to improve the wireless survey & design experience for customers, she can be found writing wireless jokes that make even the most dedicated network engineer smile (or roll their eyes).
- Cleared for Takeoff: Private Networks in Aviation - January 21, 2025
- A Tour of iBwave Viewer - November 23, 2020
- Introducing Augmented Reality in iBwave Wi-Fi Mobile - September 10, 2020


