
Uplink DAS Performance: Then & Now
Share

Distributed antenna systems (DAS) have been one of the fastest-growing types of cellular infrastructure for the past 15 years. In the late 1990’s, DAS were initially deployed inside public venues to replace less efficient technologies such as Cell on Wheels (COW). One of the earliest DAS deployments was at the Pro Player Stadium in Miami, Florida in 1999 where it was first used during the Orange Bowl and later for Super Bowl XXXIII. As mobile networks and devices have matured, DAS scope and design requirements have evolved from voice-only coverage to network capacity enhancements for voice and data-heavy applications, which require different data rates with different S/N values. With today’s 3G and 4G networks, DAS coverage consists of concentric coverage contours for voice and specific data rates, and as a rule of thumb, the higher the data rate, the smaller the coverage. Uplink coverage is still often neglected in the design process because in the past, most of the data intensive traffic such as video streaming occurred on the downlink. But the times are a changing. Nowadays, uplink data traffic at major events such as the Super Bowl is actually higher than the downlink, due to users uploading large amounts of pictures and videos on social networking sites. As 4G uplink data coverage becomes more and more important, it becomes obvious that voice-only RF design requirements that were sufficient for 2G DAS are not sufficient for today’s data demanding users.
A very simplified DAS network is illustrated in the next figure:
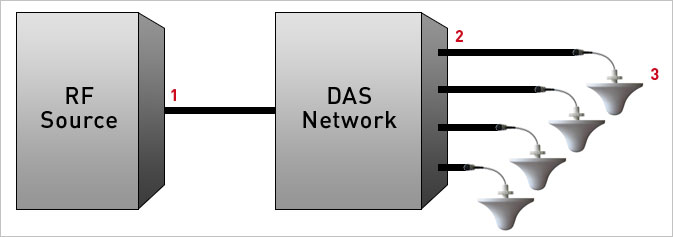
2G DAS networks were mostly passive networks, consisting of combiners, splitters, dividers and coax cables, connecting DAS antennas with a NodeB. Let’s assume that the RF source is a NodeB, that a passive DAS connected to it has a loss of G = -40 dB, and omni directional antennas have a gain of AG = 5 dBi. At location 1, which is a NodeB Tx/Rx port, we assume the transmit power of Tx1=43 dBm per channel. At location 2, which is where the passive network interfaces with the antennas, the downlink transmit power is Tx2 = Tx1 +G = 43 – 40 = 3 dBm. Location 3 is at the output of the antenna, where the transmit power is Tx3 = Tx2+AG = 3 + 5 = 8 dBm EIRP. On the uplink, the signal level of Rx3 = -75 dBm is assumed at location 3. At location 2, the signal is Rx2 = Rx3 + AG = -75 + 5 = -70 dBm. At location 1, the signal is Rx1 = Rx2 +G = -70 – 40 = -110 dBm.
If the GSM (2G) signal is carried over the DAS, then the thermal noise at location 3 is Nx3 = -174+10log(200,000) = -121 dBm. Since passive networks have no amplifiers, then Nx3 = Nx2 = Nx1 = -121 dBm. The signal to noise ratio at the antenna is (S/N)3 = Rx3 – Nx3 = -75 – (-121) = 46 dB, and at the source it is (S/N)1 = Rx1 – Nx1 = -110 – (-121) = 11 dB. Even though the S/N dropped from 46 to 11 dB, the uplink coverage is satisfactory because the minimum S/N required for GSM coverage is S/N = 9 dB.
Let’s take a look at what happens if the LTE (4G) signal is carried over the passive DAS. In a 10 MHz channel, thermal noise is Nx = -174 + 10log10(10,000,000) = -104 dBm. Assuming that the uplink LTE signal level at the antenna is the same as the GSM, then Rx3 = -75 dBm, and Rx2 = -70 dBm. Since the signal cannot be lower than the thermal noise, Rx1 = -104 dBm. At the antenna (S/N)3 = -75 – (-104) = 29 dB, and at the NodeB (S/N)1 = -104 –(-104) = 0 dB. Uplink LTE data rate per Resource Block is shown in the figure below:
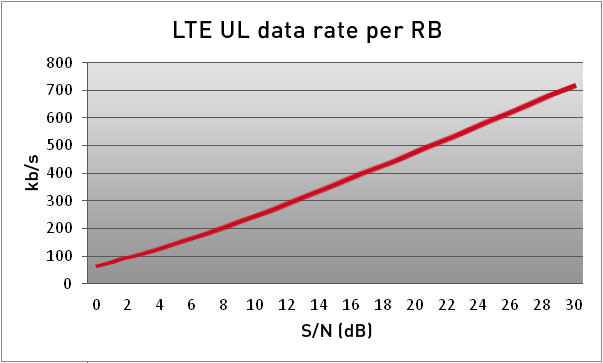
Assuming 20% overhead, up to 40 PUSCH RBs may be aggregated in a 10 MHz channel. At S/N = 0 dB, with only 70 kb/s per RB, we get composite PUSCH data rate of only 2.8 Mb/s. If the DAS loss is 24 dB instead of 40 dB, the signal at the NodeB would be Rx1 = -70 -24 = -94 dBm, and then (S/N)1 = -94 – (-104) = 10 dB, so the composite data rate is 10 Mb/s. However, the loss reduction would imply fewer antennas per NodeB, which would make the modified passive 4G DAS more expensive in terms of dollars per square foot. The transmit power would also need to be reduced to Tx1 = 43 – 16 = 27 dBm. This is comparable to the transmit power in an active DAS, with amplifiers that cost a fraction of the NodeB cost.
Let’s now assume that the LTE signal is carried over an active DAS. An active DAS consists of RF/Optical and Optical/RF converters, and RF amplifiers called “remote units”. The system noise figure and the system gain of an active DAS is a function of the network architecture, the number of remote units in the network, and their noise figure and gain. All of these vary to such an extent that there are no “typical” values for active DAS networks. The values presented here are for moderately complex active DAS; detailed calculations are omitted for brevity’s sake. Noise power at the RF source is Nx1=-104 dBm, signal is Rx1 = -75.7 dBm and (S/N)1 = -75.70 – (-104) =28.3 dB. Since S/N at the antenna is (S/N)3 = 29 dB, we see that high S/N carries over from the antenna to the RF source, which enables uplink data rate of approximately 27 Mb/s.
In these two examples, we showed that passive DAS have significant uplink S/N degradation due to the lack of uplink signal amplification, leading to low uplink data rates. On the other hand, active DAS amplifies the uplink and maintains high S/N, which enables high uplink data rates throughout the network, allowing end users to use their data heavy applications to their delight.
Converting complex ideas into simple stories is what I love to do.
- Wi-Fi Design Strategies in a Converged World Webinar Questions Part 4: Industry Related Questions - December 4, 2017
- Wi-Fi Design Strategies in a Converged World Webinar Questions Part 3: iBwave Products - October 5, 2017
- Wi-Fi Design Strategies in a Converged World Webinar: Your Questions Answered. - August 9, 2017


Hi Amna. Very interesting. In a passive DAS ( 4g), what should the ideal signal strength (-? dBm) be at the antenna to avoid noise in the uplink. Regards.